Dividend Portfolio Tracker: Complete 2025 Guide
Easily track yields, payout dates, and DRIP growth with a dividend portfolio tracker. Learn step-by-step and see how PinkLion automates income investing for you.


Why Dividend Investors Need Dedicated Tracking
Track Yield-on-Cost (YOC): Dividend investors often measure yield-on-cost – current dividend ÷ original purchase price – to see how reinvestment has boosted income over time. For example, if you bought a stock at $20 and it now pays $1.50 annually, your YOC is 7.5%. As companies raise dividends, YOC can grow dramatically, so tracking the original cost basis is crucial.
Capture Compounding via Reinvestment: Reinvesting dividends (through DRIPs) compounds returns: each payout buys more shares, which generate larger dividends next time. Over years, this “snowball effect” can add up; users who reinvest see much higher portfolio growth than those who take cash.
Include Dividends in Total Returns: Simply counting cash receipts misses dividends’ full impact on portfolio growth. A good tracker folds dividends into your performance metrics, so you see how dividends+appreciation contribute to returns. For example, one investor found dividends were two-thirds of his total return – data he captured by tracking every payout.
Handle DRIP Complexity: When dividends are automatically reinvested, your share count and cost basis change every quarter. Manually updating that is error-prone. In fact, manual DRIP tracking can make performance calculation “essentially impossible” without a system – each dividend reinvestment adds fractional shares and alters cost basis. A dedicated tracker automates this.
Quick Look: ✅ Must-Have Features in a Dividend Tracker

⚡ Automatic Price & Dividend Updates: Live price pulls (e.g. via GoogleFinance) and updated dividend info mean your yields are always current. No need to copy in new quotes or payouts manually.
🔁 DRIP & Reinvestment Calculator: Built-in DRIP support lets the tool compute new share counts for reinvested dividends (including fractional shares). You’ll instantly see how your dividend income compounds over time.
📅 Dividend Calendar / Forward Income Forecast: A rolling 12-month calendar of ex-dividend and payout dates shows upcoming cash flows. Advanced trackers even forecast forward dividend income, summing up expected payouts by month.
🔗 Broker Sync & Multi-Account Import: The best trackers can pull holdings and dividend history straight from your brokerage accounts (auto-sync). That way, you never type another transaction. PinkLion, for instance, links 10,000+ brokerages so all your dividends appear automatically.
📈 Analytics & Yield Growth: Compare current dividend yield, yield-on-cost, and track dividend growth rates over time. Dashboards for trending payouts, income charts, and metrics (like payout ratio) help you optimize which stocks to hold or add.
📱 Mobile & App Access: Some investors use a dividend tracker app on their phone for quick checks. Look for apps that sync with your data, or at least export/import from spreadsheets.
🔔 Custom Alerts: Ability to flag or notify on changes, e.g. ex-dividend announcements or dividend cuts. (PinkLion sends DRIP alerts and dividend change notifications automatically.)
⚠️ Gaps in Generic Trackers:
📝 Manual Updates: Plain spreadsheets or basic finance apps usually lack auto-updates. You’d have to re-enter dividend payouts or update share counts yourself. That means work every quarter.
🚫 No Forecasting: Generic tools rarely predict future income. You won’t easily see a calendar of next year’s dividends without extra setup.
🧩 Limited Reinvestment Handling: Spreadsheets struggle with DRIPs unless you script them. Many trackers ignore reinvestment altogether, understating your portfolio value.
🔌 Broker Disconnect: Most simple trackers can’t link to broker accounts (forcing CSV uploads or manual entry) and may miss dividends from all your accounts.
🌐 International Coverage: Tools like GoogleFinance only cover US/English markets, so tracking foreign dividends needs manual data entry or paid data sources.
🕰️ Outdated Interfaces: Some “free” trackers (like old Excel sheets) feel clunky, without modern charts or mobile support.
Build Your Own Dividend Portfolio Tracker (Google Sheets)
Example: Google Sheets can be used to calculate the next dividend payout date for each holding (using functions like MATCH and INDIRECT).
1️⃣ Pull Prices & Forward Yield via GOOGLEFINANCE
Use =GOOGLEFINANCE("TICKER","price") to fetch live stock prices. Enter each ticker (with exchange prefix if needed) and set up formulas so your sheet auto-updates. For example: =GOOGLEFINANCE(A2,"price") pulls the current price of the symbol in A2.
To get forward dividend yield: if you know the stock’s annual dividend per share (from a source or past payouts) and price, you can compute yield = (annual dividend / current price) x 100%. Some sites export forward dividend amounts via CSV or IMPORTXML, or you can input them manually. (Note: GoogleFinance itself doesn’t supply dividend yield for all stocks.)
2️⃣ Add Dividend Data via IMPORTXML or CSV
Many investors use IMPORTXML or IMPORTHTML formulas to scrape dividend dates and amounts from a finance site (e.g. Yahoo Finance or a dividend history page).
For example this equation grabs the payout table for a ticker. Paste each ticker’s URL to import its history.: =IMPORTXML("https://dividendhistory.org/payout/TSX/BMO","//table[@id='dividend_table']/*/*")
Alternatively, download CSV statements from your broker (if available) and use File→Import to bring past dividends into your sheet. Either way, aim to fill columns like Ex-Dividend Date, Payout Date, and Dividend/Share for each record.
3️⃣ Calculate Yield-on-Cost & Income Growth
Yield-on-Cost (YOC): Set a column for initial purchase price per share (your cost basis) and compute YOC = (current annual dividend ÷ purchase price)×100. As explained by Investopedia, YOC tells you the yield relative to what you paid.
Annual Dividend Income: Multiply Dividend/Share × Shares Owned to get total payout for each ticker. Then sum these across tickers for total annual income. Track this yearly to see growth.
Year-over-Year Growth: Compare total dividend income from one year to the next. A formula like =(CurrentYear/LastYear - 1)×100 shows your dividend growth rate.
4️⃣ Build a 12-Month Dividend Calendar
Create another sheet or section that lists months and quarters ahead. Use functions like FILTER or QUERY to pull upcoming Ex-Dividend and Payout dates for each holding where the date is ≥TODAY().
Organize it by month: e.g. a table with columns Jan–Dec, and list any dividends falling in each month (ticker and amount). You might use FILTER on your dividend dataset to gather all entries in the next 12 months.
This calendar view helps you see when cash arrives. (For example, PinkLion’s calendar “includes ex-dividend dates, payout amounts, and even future estimated dividends” in one place.) You can mimic that by linking your sheet’s dividend schedule to a rolling date filter.
5️⃣ Automate DRIP & Rebalancing Checks
DRIP Tracking: Add columns to update Shares Owned automatically when dividends are reinvested. For instance, if $100 dividend arrives and share price is $20, you gain 5 shares. Use a formula to increase shares if you’re enrolled in a DRIP.
Partial Shares: Allow fractional share totals (Google Sheets can handle decimals) since many DRIPs produce fractions.
Rebalancing Checks: If you periodically buy/sell to rebalance, record those transactions too (date, ticker, shares bought/sold). You can then see your portfolio weights and alert when a position drifts beyond targets.
Pro Tip: Add a “Foreign Tax” flag column. Mark any dividend that’s paid by a foreign company so you can remember to apply any withholding or report it. (This doesn’t compute taxes for you, but flags the item for manual review.)
📈 Meet PinkLion — AI Dividend Tracking & Optimization
While a spreadsheet is powerful, upgrading to PinkLion saves huge effort and adds smart features:
🔄 Auto-Import from Multiple Brokers: PinkLion syncs with your brokerage accounts (via secure API or login) to automatically import all holdings and dividends. No manual data entry ever.
🔁 Automatic DRIP Monitoring: PinkLion knows which holdings have DRIP enrolled. It updates share counts and cost basis when dividends reinvest, so you always see accurate yield-on-cost.
📊 Dividend Growth Insights: The platform tracks each stock’s dividend history, so it highlights winners/losers. PinkLion’s analytics show your dividend CAGR and raises awareness of companies growing payouts.
🔮 Forward Income Forecasts: Using market data and your holdings, PinkLion’s AI forecasts your next year’s dividends (even running “what-if” scenarios). For example, its Oracle plan offers 1-year asset forecasts and improvement suggestions, so you know exactly how your income will trend.
📅 Built-in Dividend Calendar: Similar to the sheet above, PinkLion provides an interactive calendar of upcoming ex-dividend and payment dates for your portfolio. It even estimates future dividends based on declared increases.
🚨 Advanced Analytics & Alerts: Beyond dividends, PinkLion benchmarks your yield against indexes, alerts on yield changes, and suggests small portfolio tweaks to optimize yield without extra risk.
Feature-by-Feature Comparison
| ⚙️ Feature | Google Sheets | Generic Tracker Apps | PinkLion |
|---|---|---|---|
| Automatic price updates | ✅ via GOOGLEFINANCE (US stocks) |
✅ Yahoo / Google feeds (limited) | ✅ Real-time on 100 K assets |
| Dividend payout tracking | ✅ Manual entry / IMPORTXML | ✅ Some auto (many stock apps) | ✅ Full calendar & history (auto) |
| DRIP / Reinvestment handling | ❌ Manual formulas needed | ❌ Rarely supported | ✅ Automatic DRIP calcs & alerts |
| Forward income forecasting | ❌ Must compute manually | ❌ Not available | ✅ AI-driven 1-year forecasts |
| Broker account syncing | ❌ None (CSV upload only) | ❌ Few allow API | ✅ Auto-sync with multiple brokers |
| Multi-currency / International | ❌ Limited (no int’l GOOGLEFINANCE) |
❌ Often US-centric | ✅ Global coverage (100 K tickers) |
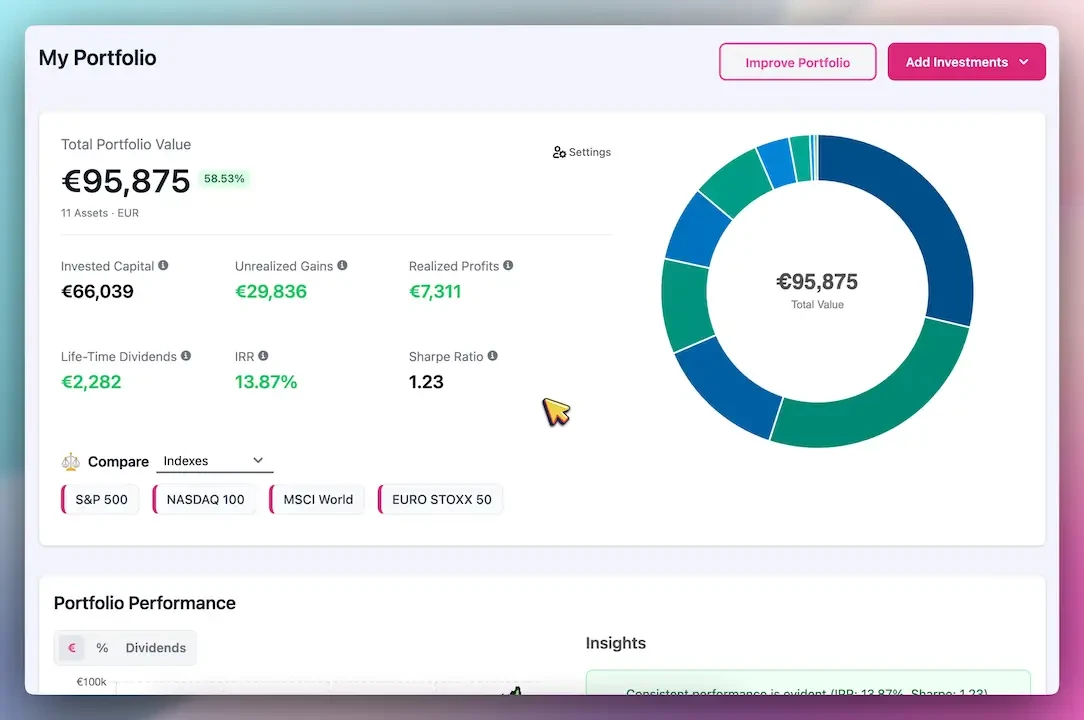
| Yield & analytics dashboard | ❌ Basic (need custom charts) | ✅ Basic performance charts | ✅ Advanced analytics (risk, Sharpe, etc.) |
| Mobile app | ❌ Google Sheets app only | ✅ Some mobile apps | ✅ Responsive web & mobile-friendly |
PinkLion Portfolio Tracker: Here
Migrate from Spreadsheet to PinkLion in 3 Minutes
Sign Up & Connect: Create a free PinkLion account and use the “Broker Connections” feature to link your brokerage logins. PinkLion will instantly import all holdings and past dividends.
CSV Import (Optional): If you prefer, export your Google Sheets or broker statements as CSV and upload them to PinkLion. The system maps your tickers and dates for you.
Finish Setup: Review your portfolio in PinkLion. All calculations (yields, calendar, DRIPs) are now automatic. You can still keep using your spreadsheet for backtesting or hypothetical scenarios, but let PinkLion be your live income-tracking dashboard.
Keep Sheets for Backtesting or Sandbox
You don’t have to abandon your spreadsheet! Many investors keep a “sandbox” Google Sheet to test dividend reinvestment scenarios or what-if allocations. Use your sheet to experiment (for example, what if you added X shares of high-yield stock?). Meanwhile, let PinkLion handle real-time tracking and alerts on your actual portfolio.
CTA: Sign up for PinkLion’s free plan.
FAQ
Q: What is a Dividend Reinvestment Plan (DRIP)?
A: A DRIP automatically uses your cash dividends to buy more shares of the same stock (often without fees). In practice, each dividend triggers a purchase of fractional shares. Brokers usually allow DRIP participants to reinvest dividends cheaply (no commission) and often at slightly discounted prices.
Q: How do fractional shares work in DRIPs?
A: When a dividend isn’t a round number, you often end up with a fractional share. That’s normal: DRIPs let you own partial shares. Your tracker should account for these fractions. For example, if a $500 dividend reinvests at $22/share, you’d buy 22.727 shares. Over time those fractions add up to whole shares and boost your income.
Q: How do I calculate Yield on Cost?
A: Yield-on-cost (YOC) is simply (current annual dividend ÷ your purchase price)×100%. It shows your dividend yield based on what you originally paid. For example, if you bought a stock at $20 and it now pays $3/year, your YOC is 15%. Tracking YOC highlights how dividend increases have amplified your returns.
Q: What is a dividend calendar?
A: A dividend calendar lays out when dividends are paid. It usually lists each holding with its upcoming ex-dividend date and pay date. By building a 12-month calendar, you can see “in one place” all future payouts. Your Google Sheet can mimic this by filtering your dividend data for upcoming dates, or you can view it in PinkLion’s built-in calendar.
Q: How often should I update my tracker?
A: If you use GOOGLEFINANCE in Sheets, prices update live when open (with slight delay). You should refresh or reopen periodically (e.g. weekly) to get the latest prices. Dividend payouts occur on fixed schedules (quarterly, etc.), so record each dividend when received. With auto-sync tools like PinkLion, updates happen instantly across all accounts.
Q: Can I track multiple portfolios in one sheet?
A: Yes – just use separate tabs or sections for each portfolio. For example, a “Retirement” tab and a “Brokerage” tab within the same Google file. This way you can see overall income per portfolio. PinkLion also allows multiple portfolios if you want to separate goals.
Q: Does PinkLion cost money?
A: PinkLion offers a Free (Seedling) plan that includes unlimited holdings and basic dividend tracking & forecasting. That’s perfect for most needs. Paid plans (Strategist, Oracle) add unlimited simulations, broker syncing, and AI forecasting. You can start free and upgrade later for advanced features like automatic broker imports and 1-year AI forecasts.
Q: Can I use international stocks in Google Sheets?
A: GOOGLEFINANCE only supports US/English markets and major exchanges. To track foreign dividends, you’d need to import data manually or use another API. PinkLion covers 100,000+ global stocks and ETFs, so it will fetch dividends from international markets automatically, avoiding that limitation.
Conclusion
Tracking dividends properly is the key to maximizing income and retirement stability. You now have everything to build a robust dividend tracker: a free Google Sheets template, step-by-step formulas, and a comparison of DIY vs. AI tools.
Equip yourself with the best tools, and watch your dividend income soar!