Google Sheets Portfolio Tracker: A Beginner’s DIY Guide
Create a Google Sheets portfolio tracker with live prices, free templates, and pro tips. Build your own stock dashboard in minutes no paid software required.

What is a Google Sheets Portfolio Tracker?
A portfolio tracker is a Google Sheets spreadsheet where you list your investments (stocks, ETFs, crypto, etc.) and use formulas to track how they’re doing.
- It typically shows each asset’s current price, share count, total value, gains/losses, and your overall portfolio value.
- Beginners use it to learn the basics, track progress toward goals, and keep everything in one place without paying for dedicated software.
Why Use Google Sheets for Portfolio Tracking?
🆓 Free & Accessible: Google Sheets is free, cloud-based, and works on any device, so there’s nothing to buy or install.
🛠️ Customizable: You control the columns and formulas, so the sheet fits your needs. It’s also easy to add notes or tweak calculations as you go.
🤝 Collaboration: You can share the tracker with others and check it on mobile. For many beginners, the Google interface is already familiar.
📈 Integrated Data: Google Sheets supports the GOOGLEFINANCE function, which pulls live market data into your sheet. That means no manual price checks for US stocks and ETFs.
🎓 Educational: Setting it up yourself helps you understand how investing works (tickers, dividends, P/L) by seeing the numbers update in real time.
Step-by-Step: Build Your Google Sheets Portfolio Tracker
1. Set Up Your Sheet
Decide which assets to track (stocks, ETFs, crypto). Create columns like: Ticker Symbol, Shares Owned, Purchase Price, Current Price, Current Value, Daily Change, Profit/Loss.
2. Set Up Your Sheet
- Open a new Google Sheet.
- Label headers (e.g. A1: “=Ticker”, B1: “Shares”, C1: “Purchase Price”, D1: “Current Price”, E1: “Current Value”, F1: “P/L”).
- Freeze the header row (View → Freeze) so column titles stay visible.
- Format columns (e.g. currency for prices, number for shares).
4. Enter Static Data
In each row, enter the ticker symbol (e.g. AAPL) and how many shares you own. Input your purchase price (what you paid per share).
5. Pull Live Prices with GOOGLEFINANCE
Use the built-in function to fetch current prices. For example:
- In D2, enter
=GOOGLEFINANCE(A2,"price")to get the real-time price for the ticker in A2. - If needed, include exchange prefix (e.g.
NASDAQ:GOOG). Many tickers auto-detect. - GoogleFinance can also fetch yesterday’s close (
closeyest) and percent change (changepct). For example:=GOOGLEFINANCE(A2,"changepct"). - Note: Google warns that
GOOGLEFINANCEis only available in English and does not support most international exchanges. Price quotes may be delayed (often ~20 minutes). This is fine for casual tracking.
6. Calculate Current Value and Returns
- In E2, compute Current Value as
=D2*B2(price × shares). Drag this down for all rows. - To get Profit/Loss (in $), use
=(D2-C2)*B2(difference between current and purchase price times shares). - To get Portfolio Total, use a SUM formula: e.g. in E10 (below your list),
=SUM(E2:E9)adds up all values. Similarly sum the P/L column. - For percentage return on each asset:
=((D2/C2)-1). - For overall return:
=(Total Current Value - Total Cost)/Total Cost * 100. - Example Formulas: If B2=10 shares of AAPL, C2=$150 purchase, D2 pulled from GOOGLEFINANCE, then E2=
=B2*D2.
7. Visualize and Format
- Use conditional formatting to highlight gains (green) vs. losses (red) in the P/L column.
- Insert charts or sparklines to show trends. For example, after fetching historical prices (if desired), use
=SPARKLINE(range)to show a mini-chart of the last 30 days’ prices. - (Optional) Add a pie chart of portfolio allocation by value or asset class.
8. Automate Updates
- Google Sheets will auto-refresh formulas when the sheet is open, but you can also click Refresh All or simply re-open the sheet to update prices.
- To avoid too many live calls, some users keep a hidden tab with raw
GOOGLEFINANCEdata and useIMPORTRANGEto pull values into a clean display sheet. This reduces flicker and errors when editing.
9. Downloadable Resources
- CTA: Download our free Google Sheets portfolio tracker template to skip the setup. It includes all the columns above with sample formulas.
Key Google Sheets Formulas and Tips
GOOGLEFINANCE Examples: =GOOGLEFINANCE("MSFT","price") returns Microsoft’s price. Use cell references: =GOOGLEFINANCE($A2,"price"). Other useful attributes: closeyest, marketcap, volume.
SUMPRODUCT for Totals: For total value across many rows, =SUMPRODUCT(D2:D10, B2:B10) multiplies each row’s price by shares and sums them (alternative to separate row formulas).
ARRAYFORMULA (Advanced): To auto-fill calculations: e.g. =ARRAYFORMULA(IF(A2:A="", "", A2:A * B2:B)) can compute values for entire columns without dragging. (Not required for beginners, but useful for scaling.)
Cell Formatting: Format currency columns with 2 decimals, percentages with %. Freeze header row for easier viewing.
Data Validation: (Optional) Use drop-down lists for ticker symbols to avoid typos (Data → Data validation).
Limiting Errors: #N/A errors appear if GoogleFinance can’t find data (e.g. typo, unsupported symbol). Double-check ticker formats.
Limitations of Google Sheets Portfolio Trackers
🌍 Coverage Limits: GoogleFinance data is US/English-centric. You can’t track most international stocks or exchanges directly. Cryptocurrencies are not supported by GOOGLEFINANCE (you’d need other APIs or manual entry).
⏳ Data Delay: Prices are not truly real-time. Google states quotes “may be delayed up to 20 minutes”. This means very recent price moves may not appear instantly in your sheet.
🚦 API Quotas: Free Google accounts have a limit of about 20,000 external data fetches per day. Heavy use of GOOGLEFINANCE (or import scripts) can hit this limit, causing errors (like #ERROR!).
🔄 Rate Limiting: There’s no strict daily cap on GOOGLEFINANCE, but Google advises limiting refresh rate. Updating once every 1–2 minutes is recommended. If you force more frequent updates, formulas may fail or slow your sheet.
✍️ Manual Entry: You must manually input trades or dividend information. Google Sheets won’t pull in your brokerage transactions automatically. This makes portfolio rebalance and dividends a manual chore.
🐢 Scalability & Performance: Spreadsheets with hundreds of rows and formulas can become slow or crash, especially on mobile. Large portfolios (100+ assets) often require splitting data or using APIs like Alpha Vantage (with its own limits).
⚠️ Error-Prone: Spreadsheets are prone to human error (wrong formula, deleted column, wrong ticker). Beginners may misconfigure formulas without realizing it.
🚧 Not Professional Grade: As Google notes, GoogleFinance is “provided as is” and isn’t for professional use. It’s great for learning, but errors or outages could mislead.
Free Resources: Template
Portfolio Tracker Template: Access here
Introducing PinkLion: AI-Enhanced Portfolio Tracking
What is PinkLion? PinkLion is an AI-powered investment platform for retail investors. It goes beyond manual tracking by providing intelligent portfolio insights.
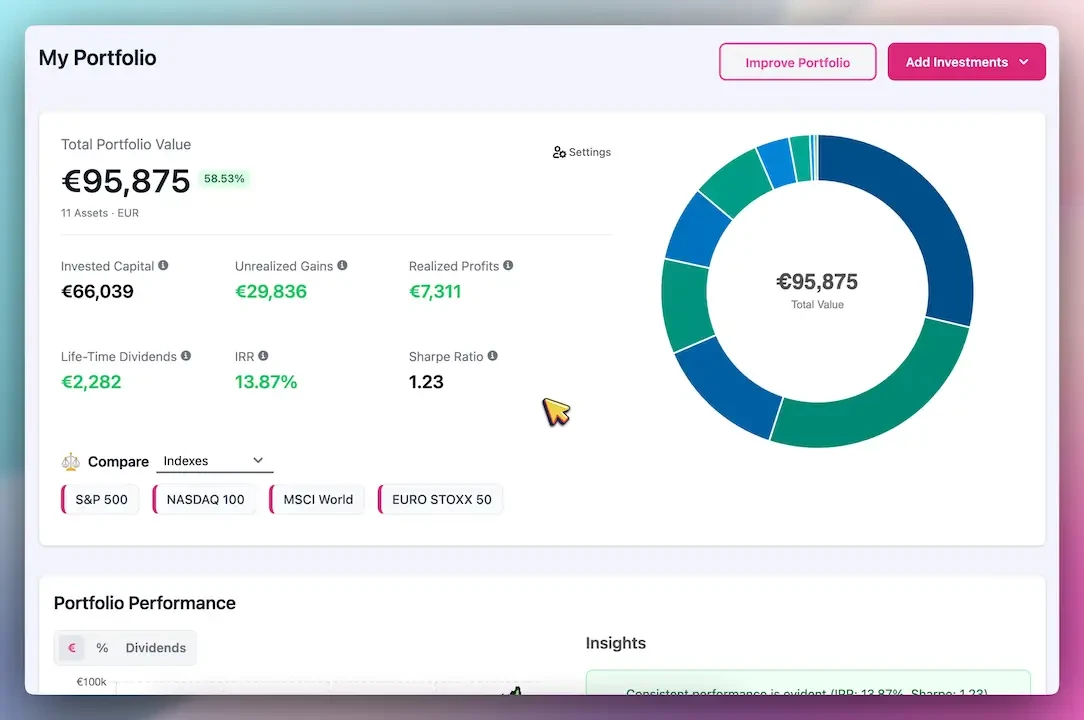
🗂️ All-in-One Dashboard: PinkLion can sync with your brokerage accounts (automatic integrations) to import holdings across brokers. You see all stocks, ETFs, crypto in one place, updated in real time.
📈 Smart Analytics: Built-in analytics spot trends and portfolio risks. AI-based features let you run “what-if” scenarios and optimize your holdings automatically.
🔮 Forecasting & Simulations: Unlike static sheets, PinkLion offers 1-year asset forecasts and stress-testing against market events.
🖱️ User-Friendly: No need to write formulas. The interface is designed for beginners – it’s like having a personal investment advisor that handles calculations for you.
💸 Free Plan: Even the free PinkLion plan supports unlimited holdings and covers 100,000+ stocks, ETFs, and crypto with 30 years of historical data.
⏭️ When to Upgrade: If your Google Sheet gets too complex or manual tasks pile up, PinkLion is the “next step.” It minimizes errors and saves time.
CTA: Sign up for PinkLion’s free plan.
Google Sheets vs PinkLion: Feature Comparison
| 📊 Feature | Google Sheets (DIY) | PinkLion (AI Platform) |
|---|---|---|
| Setup & Templates | Build sheet manually or use basic templates. | Guided setup with built-in templates. |
| Data Integration | Manual entry + GOOGLEFINANCE (limited exchanges). |
Automatic broker connections, live sync. |
| Assets Covered | Mostly US stocks & ETFs (crypto manual). | 100 000+ stocks, ETFs, crypto. |
| Update Frequency | ≈20-min delay, manual refresh. | Real-time updates across accounts. |
| Portfolio Size | Handles dozens of assets (slow >100). | Unlimited holdings (free plan). |
| Analytics & Forecasting | DIY formulas & charts. | Built-in analytics, AI forecasts & stress tests. |
| Ease of Use | Requires spreadsheet skills. | Intuitive interface, no formulas needed. |
| Collaboration | Share via Google Drive. | Web dashboard, sharable reports. |
| Cost | Free (just your time). | Freemium: free basics, €5–€15 /mo premium. |
| Security | Data stored in your Google account. | Bank-level encryption; no broker creds stored. |
FAQs
Q: What is a Google Sheets portfolio tracker?
A: A spreadsheet that lists your investments and uses formulas (like GOOGLEFINANCE) to track value and returns. It’s a customizable, DIY way to monitor a portfolio.
Q: How do I pull live stock prices?
A: Use =GOOGLEFINANCE("Ticker","price"). For example =GOOGLEFINANCE("AAPL","price") updates Apple’s price. Be aware prices may lag by up to ~20 minutes.
Q: Can I track cryptocurrency in Sheets?
A: Not directly with GOOGLEFINANCE. You’d need to use a crypto price API or CSV import. Some tokens appear if listed on Google Finance in USD, but coverage is limited.
Q: Are there limits to GOOGLEFINANCE?
A: There’s no fixed “daily call limit,” but Google throttles frequent requests. Free accounts get ~20,000 fetches/day. Also, only certain data fields are available (e.g. no intraday ticks).
Q: How often does the sheet update?
A: GoogleSheets recalculates formulas when the file is open or edited. GOOGLEFINANCE data typically refreshes every 1-2 minutes when viewing the sheet. It won’t auto-update while closed.
Q: Is there a free template I can use?
A: Yes! We offer a free downloadable Google Sheets portfolio tracker template (see Resources section). It comes pre-filled with columns and example formulas.
Q: When should I consider switching to PinkLion?
A: When manual tracking becomes tedious or you want smarter insights. If you need automatic account syncing, AI-driven analytics, or tracking beyond basic stocks, PinkLion’s tools can save time and reduce errors.
Q: How secure is my data?
A: Google Sheets data is stored in your Google Drive (protected by your Google account security). PinkLion uses bank-level encryption and never stores your broker passwords, focusing on privacy and safety.