13 Best Koyfin Alternatives in 2025
Compare the best Koyfin alternatives for 2025 side-by-side pricing, broker sync, dividend tools, and AI analytics to find the perfect market-data platform for your workflow.

Table of Content
Comparison Table
| Feature |
|
|
|
|
|
|
|
|
|
|
|
|
|
|---|---|---|---|---|---|---|---|---|---|---|---|---|---|
| Portfolio Analytics | Advanced | Advanced | Basic | Advanced | Limited | No | Basic | Advanced | Advanced | Advanced | Basic | Advanced | Basic |
| Dividend Tracking | Dividends per asset only | Dividend Portfolio Aggregation Dividend forecast Calendar |
Dividend Portfolio Aggregation Dividend forecast |
Dividend Portfolio Aggregation Dividend forecast |
Dividends per asset only | Dividends per asset only Calendar |
Dividends per asset only Calendar |
Dividend Portfolio Aggregation | Dividend Portfolio Aggregation Dividend forecast Calendar |
Dividend Portfolio Aggregation Calendar Goal setting |
Dividend Portfolio Aggregation Payout alerts Calendar |
Historical income in sims | Dividends per asset only |
| Fundamental Analysis | 10 yr data Analyst estimates |
Full financials (P&L, Cash Flow, Balance Sheet) Analyst estimates Snowflake score 30 yr data |
Full financials (P&L, Cash Flow, BS) Analyst estimates Snowflake score |
Ziggma score Price ratios |
20 yr data Analyst estimates |
Profiles & Comparisons | Sentiment & Insider flow | — | — | — | — | Factor & Correlation tools | Full financials (P&L, Cash Flow, BS) Analyst estimates |
| Valuation Models | Ratio charts | Discounted Cash Flows Analyst targets AI price forecast |
Discounted Cash Flow Analyst targets |
— | Interactive Discounted Cash Flow | Multiples only | Analyst targets | — | — | — | — | Monte-Carlo & optimiser | Multiples Analyst targets |
| Risk & Optimization | β, Sharpe, Drawdown | Crash tests AI optimization & rebalance |
Diversification charts | Risk score Simulator |
Back-test factors | Sector mix | Smart-score alerts | MWR/IRR & allocation | Sharpe, Beta Backtests |
Beta, Volatility, Turnover | Beta & Diversification charts | VaR Efficient frontier |
Beta & volatility |
| Portfolio Integration | Manual only | Manual + Broker sync | Manual + Broker sync | Manual + Broker sync | Manual only | Manual only | Manual + Broker sync | Manual + Broker sync | Manual + Broker sync | Manual only | Manual + Broker sync | Manual only | Manual + Broker sync |
| Access | Web + iOS | Web only | Web + iOS/Android | Web only | Web only | Web only | Web + iOS/Android | Web + iOS/Android | Web + iOS/Android | Web only | iOS/Android | Web only | Web + iOS/Android |
| Pricing | Free Plus $39/mo Premium $79/mo |
Free Strategist $5.50/mo Oracle $17.50/mo |
Free Premium $10/mo Unlimited $20/mo |
Free Starter $9.99 Investor $14.99/mo Expert $19.99/mo |
Free Plus $19.95/mo Pro $39.95/mo |
Free Pro $9.99/mo |
Free Premium $30/mo Ultimate $50/mo |
Free Standard $9.40/mo Pro $24/mo Premium $31/mo |
Free Starter $9.40/mo Investor $17.50/mo Expert $29.20/mo |
Free $7.50/mo |
Free Pro $3.99/mo Ultimate $6.99/mo |
Free Basic $260/yr Pro $660/yr |
Free Plus Lite $25/mo Plus Essential $35/mo |
| Market Coverage | Global | Global | Global | Global | Global | Global | US-centric | Global | Global | Global | US | US | Global |
Why You Might Need a Koyfin Alternatives?
Even though Koyfin packs a solid punch of market data and macro dashboards, many investors search for Koyfin alternatives when they hit common pain points.
Steep monthly prices after the free tier, no automatic broker-sync for live portfolios, a desktop-centric interface with a learning curve, limited dividend, and the absence of AI-driven forecasting or stress-testing. If any of those gaps slow down your workflow or you simply want a platform that’s cheaper, easier to use, or richer in portfolio analytics, it’s time to explore the best Koyfin alternatives on the market.
Deep-Dive Reviews (13 tools)
Explore concise, tool-by-tool breakdowns features, pricing, pros, and ideal users for all 13 Koyfin alternatives so you can zero in on the best fit in minutes.
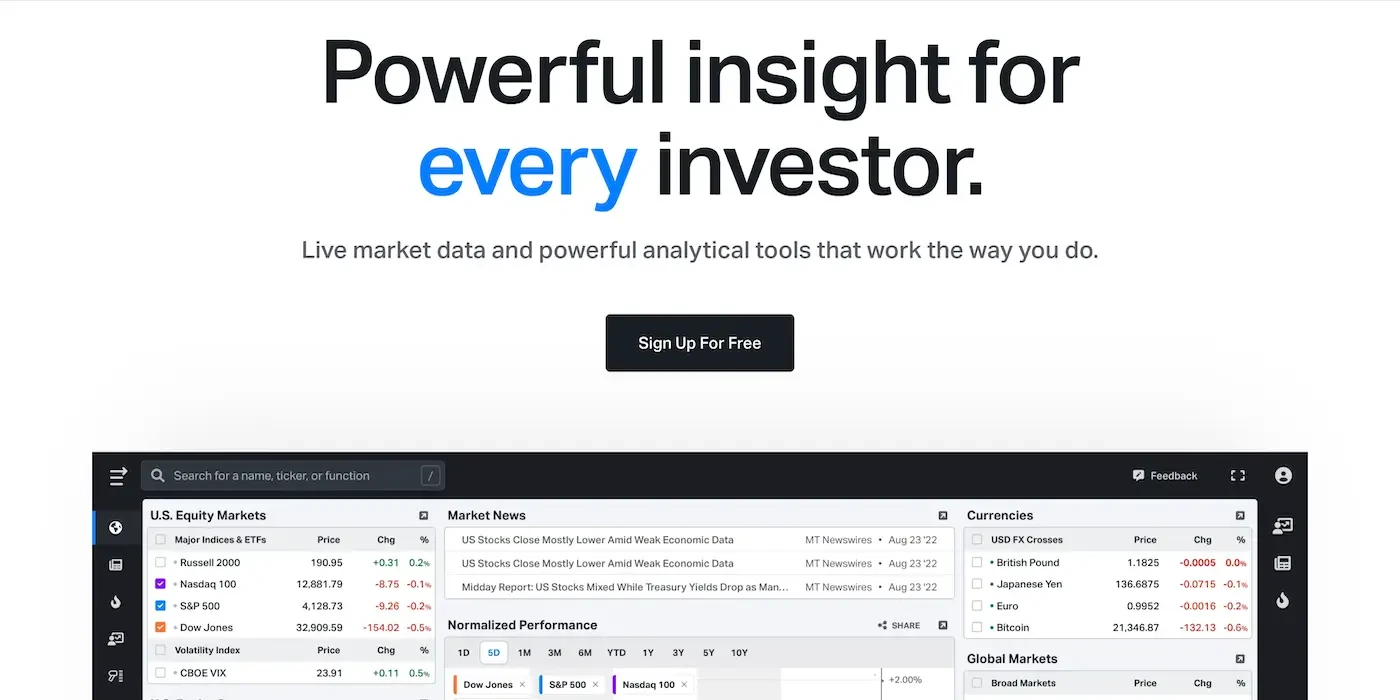
Koyfin — Multi-Asset Market Data
1. Quick Snapshot
| Key Point | Details |
|---|---|
| Focus | Real-time market data, charting, macro dashboards & financial statement visualizations |
| Coverage | 100,000+ global stocks, ETFs, bonds, FX, commodities & economic indicators |
| Platforms | Web • macOS desktop app • iOS companion |
| Pricing | Free • Plus $39/mo • Premium $79/mo (annual billing discounts) |
2. Core Features
Advanced Charts & Dashboards
- Price, ratio, and fundamentals charts with up to 20-year history, and multi-asset overlays.
Financial Statement Explorer
- Side-by-side income, cash-flow and balance-sheet visuals with YoY and QoQ growth, margins and per-share views.
Macro & Equity Dashboards
- Pre-built views for rates, curves, credit spreads, FX, commodities, sectors, market breadth and more, updated in real time.
Custom Watchlists & Alerts
- Tag tickers, create heat maps, and receive email / in-app alerts on price moves, technical crossovers or economic releases.
Powerful Stock Screener
- Filter the global universe on valuation, growth, profitability, momentum, dividends and technical signals.
Excel & API Export (Premium)
- One-click export of chart data or fundamentals to Excel or via REST API for deeper models.
3. Pros 🚀
- Institutional-style visualizations – heat maps, multi-panel dashboards and scatter plots rival pro terminals.
- Cross-asset coverage – equities, credit, macro and FX in one workspace.
- Highly customizable – user formulas, saved layouts, dark/light modes and keyboard shortcuts.
4. Cons ⚠️
- No broker sync – portfolios must be entered manually; no automatic performance tracking.
- Pricing jump – key features like full statement history and exports require Plus or Premium plans.
- Learning curve – dense UI can overwhelm first-time users.
- Dividend & tax tools are minimal – income investors may need a dedicated tracker.
- Mobile limited – iOS app focuses on watchlists; full functionality is desktop-first.
5. Ideal For ✅
Active traders, macro analysts and data-driven investors who need real-time, multi-asset charts and economic dashboards and are comfortable building custom views manually.
Koyfin delivers Bloomberg-style market visuals, deep macro data and flexible charting without the six-figure terminal bill.
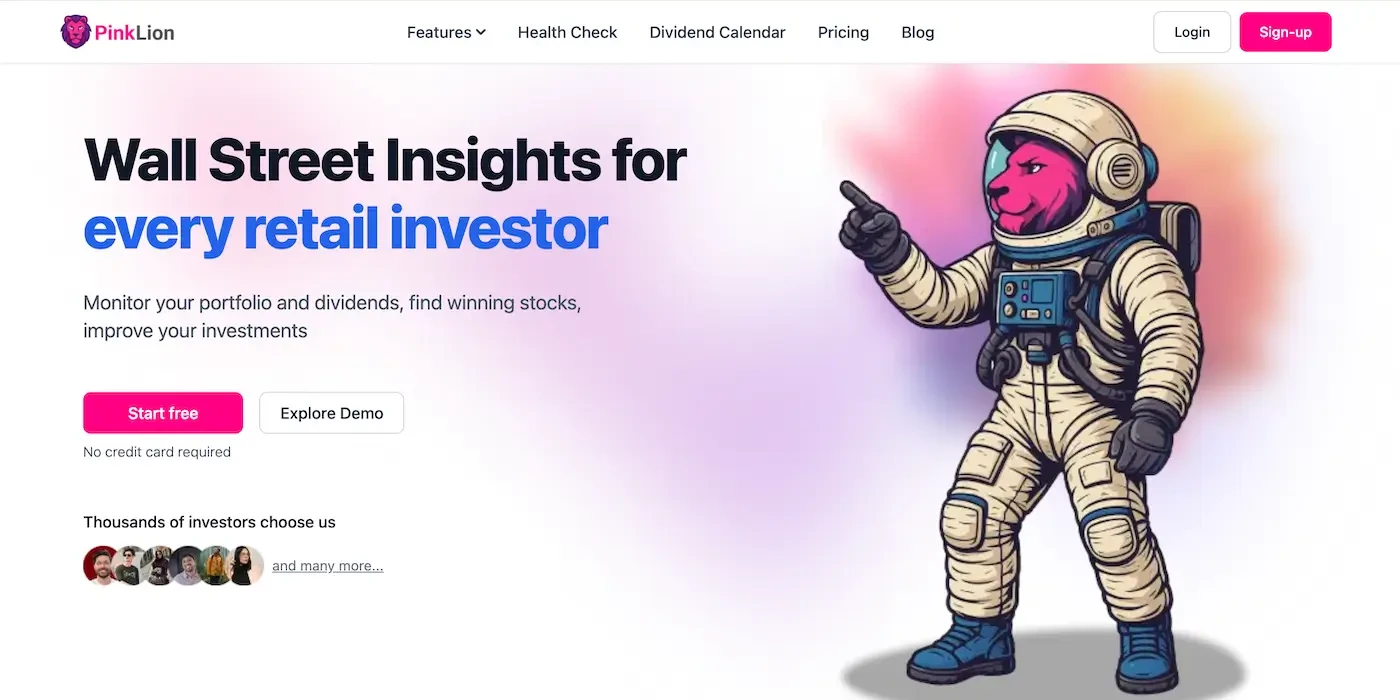
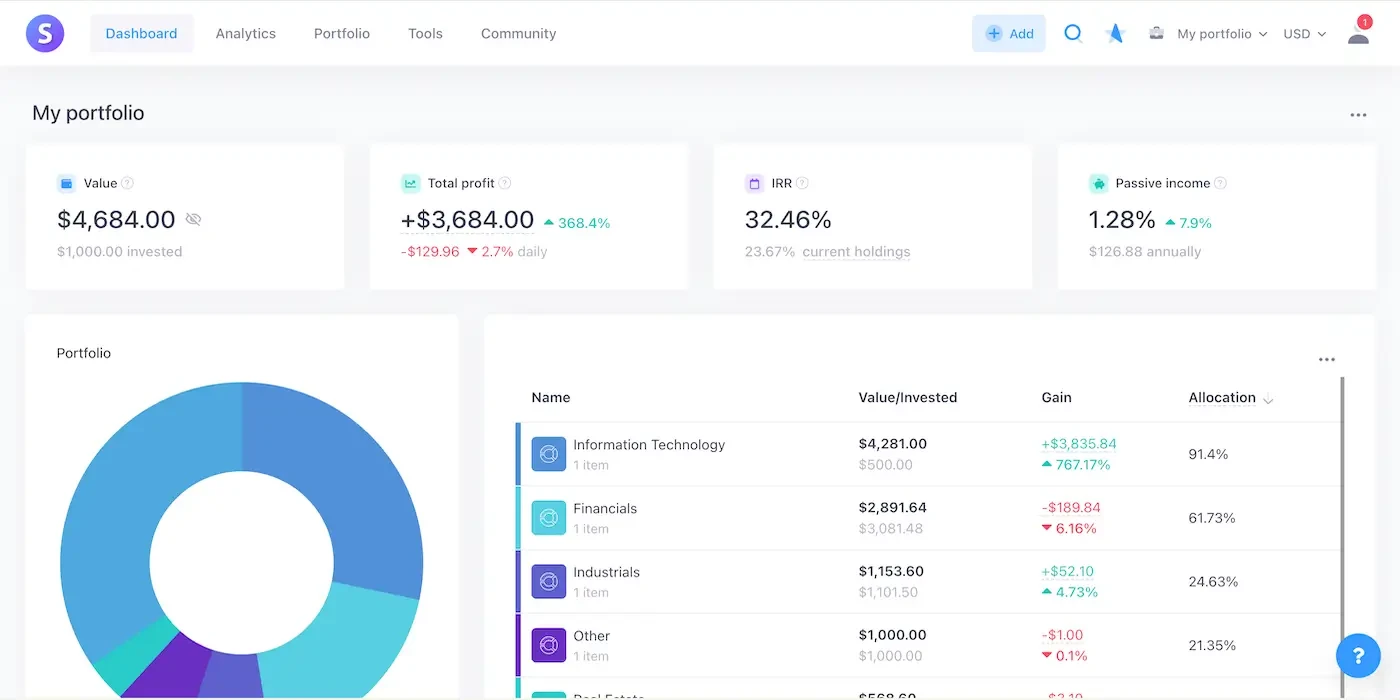
PinkLion — AI-Powered Portfolio Tracking, Forecasting & Insights
1. Quick Snapshot
| Key Point | Details |
|---|---|
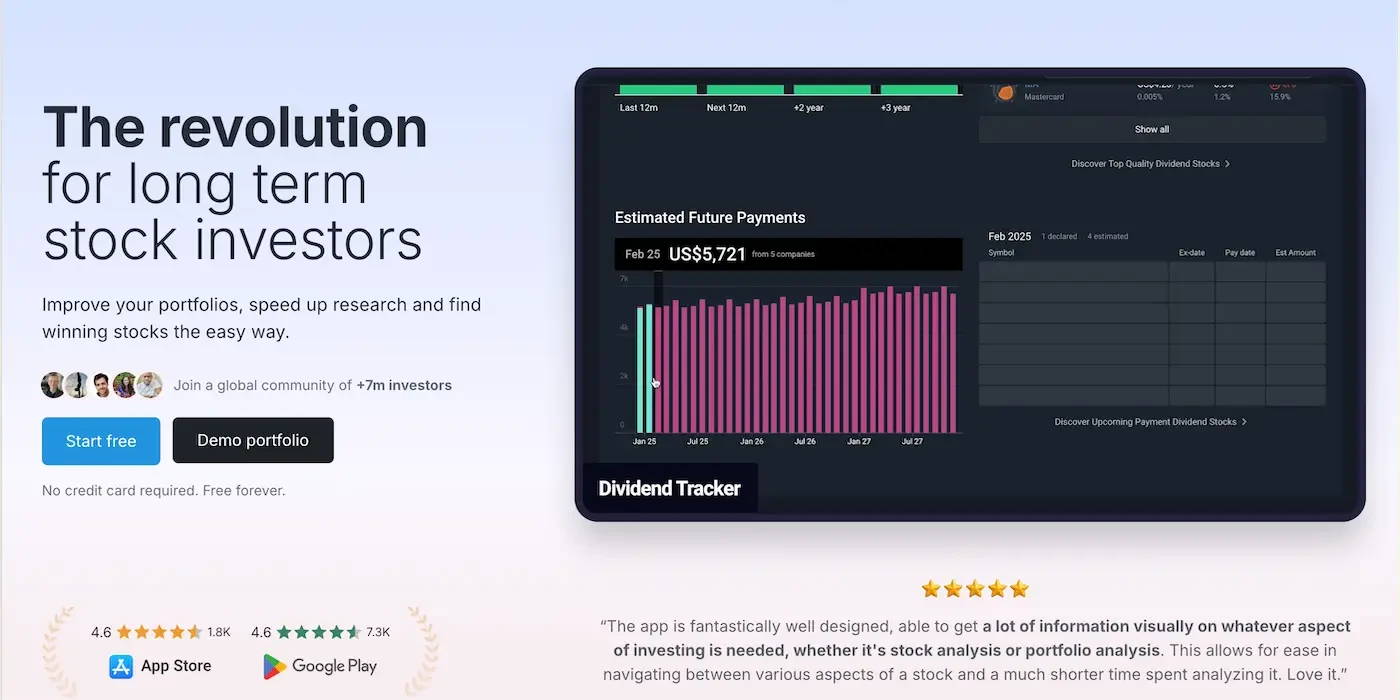
| Focus | End-to-end portfolio tracking, AI forecasts, dividend tools & crash-test simulations |
| Coverage | 100 k+ stocks, ETFs, mutual funds & crypto with 30 years of price-and-fundamental history |
| Platforms | Web (mobile-responsive) |
| Pricing | Free • Strategist $5.50/mo • Oracle $17.50/mo |
2. Core Features
All-in-One Tracking
- Unlimited tracking of stocks, ETFs, mutual funds & crypto (100 k+ tickers, 30 years of price & fundamental history) with unlimited holdings even on the free tier
Broker Sync + CSV Import
- Automatic integrations keep every account up-to-date, no spreadsheets.
Dividend Suite
- Yield-on-cost, payout calendar, forward income, and DRIP handling.
AI Toolkit
- 12-month price & income forecasts.
- “Improve Portfolio” recommendations flag concentration, risk/return gaps and diversification fixes.
- Scenario Simulations
Historical Stress Tests
- DCF fair value, P/E, P/S, P/B and full statements for every ticker.
One-Click Valuation
- Filter the global universe on valuation, growth, profitability, momentum, dividends and technical signals.
Fundamental Research Shortcuts
- Stock & ETF comparison pages plus ready-made reports for 100 k+ tickers.
3. Pros 🚀
- AI insights for $5.50/mo — the lowest-cost way to access automated forecasts, crash tests and optimization hints.
- Broker-sync + unlimited holdings — eliminates spreadsheets and pay-walled trackers, even on the free tier.
- Global multi-asset coverage — track stocks, ETFs, and crypto side by side in one dashboard.
- Deep dividend tooling — payout calendar, yield-on-cost and safety scores outclass most dedicated dividend apps.
- Fundamental Analysis — Insightful asset reports for 100,000+ tickers.
4. Cons ⚠️
- Web-only — mobile-responsive, but no native push alerts.
- No intraday options — no day-trading features, built for investors, not scalpers.
- Advanced AI paywall — AI features like simulations require the higher-tier Oracle plan.
- Quotes refresh on exchange intervals, not tick-by-tick.
5. Ideal Use Case ✅
Long-term stock or ETF holders, dividend-growth investors and crypto adopters who want one pane of glass for tracking, risk testing and forward planning without Bloomberg-level fees. Perfect for spreadsheet migrants craving low-cost AI guidance.
PinkLion rolls broker sync, dividend tracking, AI forecasting, asset reports, and historical crash testing into a single, elegant dashboard, for less than the price of your monthly latte.
Simply Wall St – Fundamental Analysis & Portfolio Insights
1. Quick Snapshot
| Key Point | Details |
|---|---|
| Focus | Visual fundamental analysis, portfolio tracking, dividend & diversification tools |
| Coverage | 100 K+ global stocks (powered by S&P Capital IQ data) |
| Platforms | Web • iOS • Android |
| Pricing | Free • Premium $10/mo • Unlimited $20/mo (annual billing discounts) |
2. Core Features
Visual “Snowflake” Reports
- At-a-glance scorecard for Value, Future Growth, Past Performance, Financial Health & Dividends
- Color-coded design simplifies complex ratios for quick decisions
Portfolio & Broker Sync
- Link 2000+ brokers or upload CSVs for auto-updated holdings, P/L & diversification charts
Stock Screener & Watchlists
- Filter global equities by P/E, PEG, dividend yield, growth, insider ownership & more
- Save custom screeners and receive automated alerts
Research Hub
- Analyst forecasts, intrinsic-value charts (DCF), peer comparisons & management notes in one page
- Live news and earning-call snippets curated for each ticker
- Built-in dividend forecast & upcoming payout calendar
3. Pros 🚀
- Beginner-friendly visuals – Infographic “Snowflake” makes fundamentals easy to digest.
- Global market reach – Covers U.S., EU, APAC & emerging-market equities.
- Useful free tier – View a limited number of stocks and portfolios at no cost.
- Mobile apps – Full functionality on iOS & Android for tracking on the go.
- Broker aggregation – No more spreadsheets holdings stay in sync automatically.
4. Cons ⚠️
- Advanced data paywalled – Unlimited stock views & deeper ratios require Premium/Unlimited.
- Limited technical analysis – Few chart indicators, not suited for day-traders.
- No custom metrics – Users can’t create bespoke formulas or import niche datasets.
- Manual valuation tweaks – DCF assumptions aren’t editable for power users.
5. Ideal Use Case ✅
Long-term value or dividend investors who prefer clear visuals over raw spreadsheets. Great for beginners needing confidence in stock-picking and for intermediates monitoring diversification & payout health.
Simply Wall St turns dense financial statements into intuitive visuals and portfolio insights. If you’re a fundamentals-first investor looking for global coverage, automated dividend tracking, and an easy learning curve.
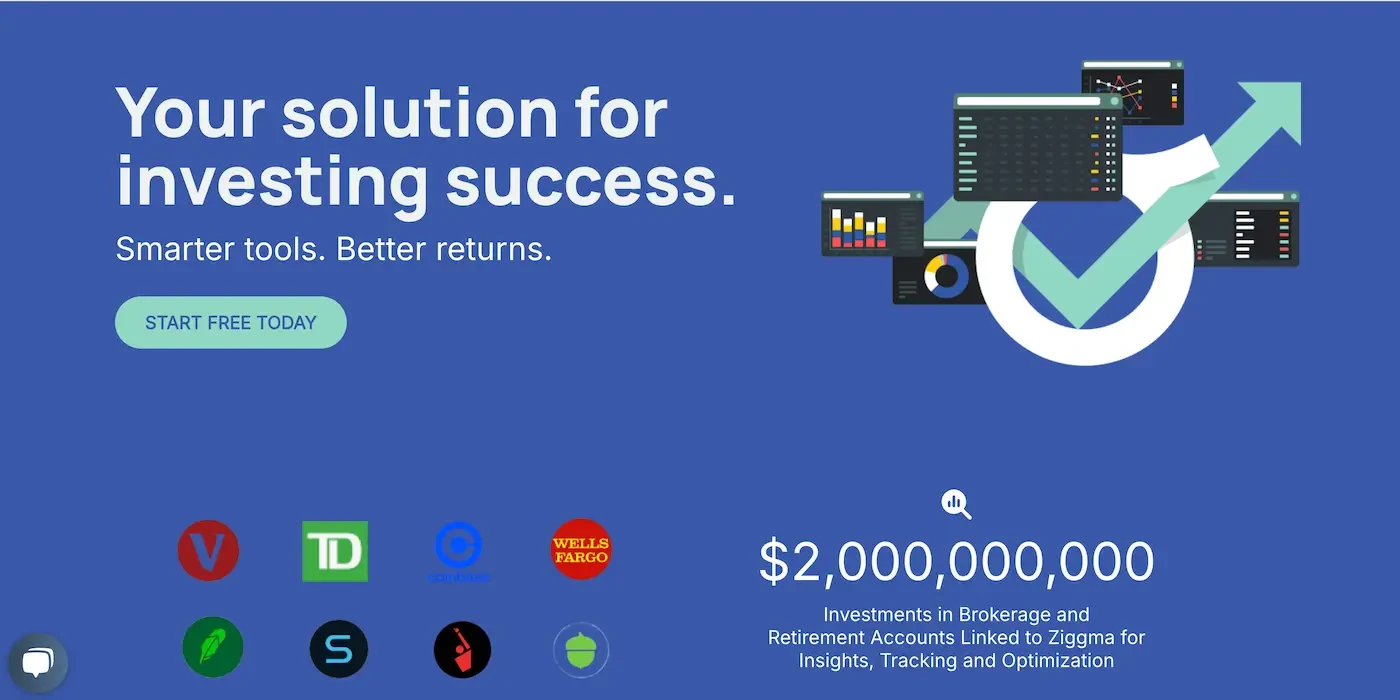
Ziggma – Portfolio Tracker with Stock Scores
1. Quick Snapshot
| Key Point | Details |
|---|---|
| Focus | Account-aggregated portfolio analytics, proprietary Stock Scores, risk & dividend tools |
| Coverage | U.S. & global equities, ETFs, broker sync + manual/CSV imports |
| Platforms | Web (mobile-responsive) |
| Pricing | Free • Starter $6.99 • Investor $14.99 • Expert $19.99 per mo (annual billing) |
2. Core Features
Unified Portfolio Dashboard
- Link multiple broker, IRA, 401(k) accounts for a single view of allocation, risk and income.
- Auto-updates holdings, shows sector mix, beta, volatility and dividend yield.
Ziggma Stock Scores (0-100)
- Algorithm rates every stock on growth, valuation, profitability & balance-sheet strength, benchmarked against industry peers.
- Integrates into the screener so you can surface “best-in-class” ideas fast.
Portfolio Simulator
- Model any buy/sell before you trade, see instant impact on diversification, dividend yield and risk metrics.
Dividend Tracker & Forecast
- Aggregates portfolio income and projects future payouts, supports dividend calendar & yield-on-cost views.
Smart Alerts & Top 50 Lists
- Set thresholds on price, P/E, yield, or Stock Score, receive email alerts when triggered.
- Curated “Ziggma Top 50” lists highlight high-scoring stocks by sector.
3. Pros 🚀
- Holistic analytics – Portfolio beta, VaR, volatility and even carbon-footprint metrics in one dashboard.
- Trade-before-you-trade simulator – rare among retail trackers, great for stress-free re-balancing.
- Account aggregation – supports major U.S. brokers plus manual CSV for everything else.
- Affordable tiers – full feature set tops out under $20/mo, free plan still useful for a single portfolio.
- Dividend & ESG extras – income forecasting and optional climate/ESG filters for screening.
4. Cons ⚠️
- U.S.-centric data – global quotes supported, but deepest coverage & broker sync skew to U.S. markets.
- Web-only – no native iOS/Android app yet, mobile works but lacks push alerts.
- No advanced valuation models – DCF or scenario testing not built-in.
- Limited technical charts – basic price charts, traders will still need a charting platform.
5. Ideal For ✅
DIY investors with multiple brokerage accounts who want to optimize long-term portfolios: dividend growers, quality-score stock pickers and anyone who likes “what-if” trade simulation before hitting the buy button.
Ziggma blends robust portfolio analytics, proprietary quality scores, and a unique trade simulator all at a wallet-friendly price. If you’re a buy-and-hold investor who juggles several accounts and wants data-driven nudges to improve diversification, yield and risk.
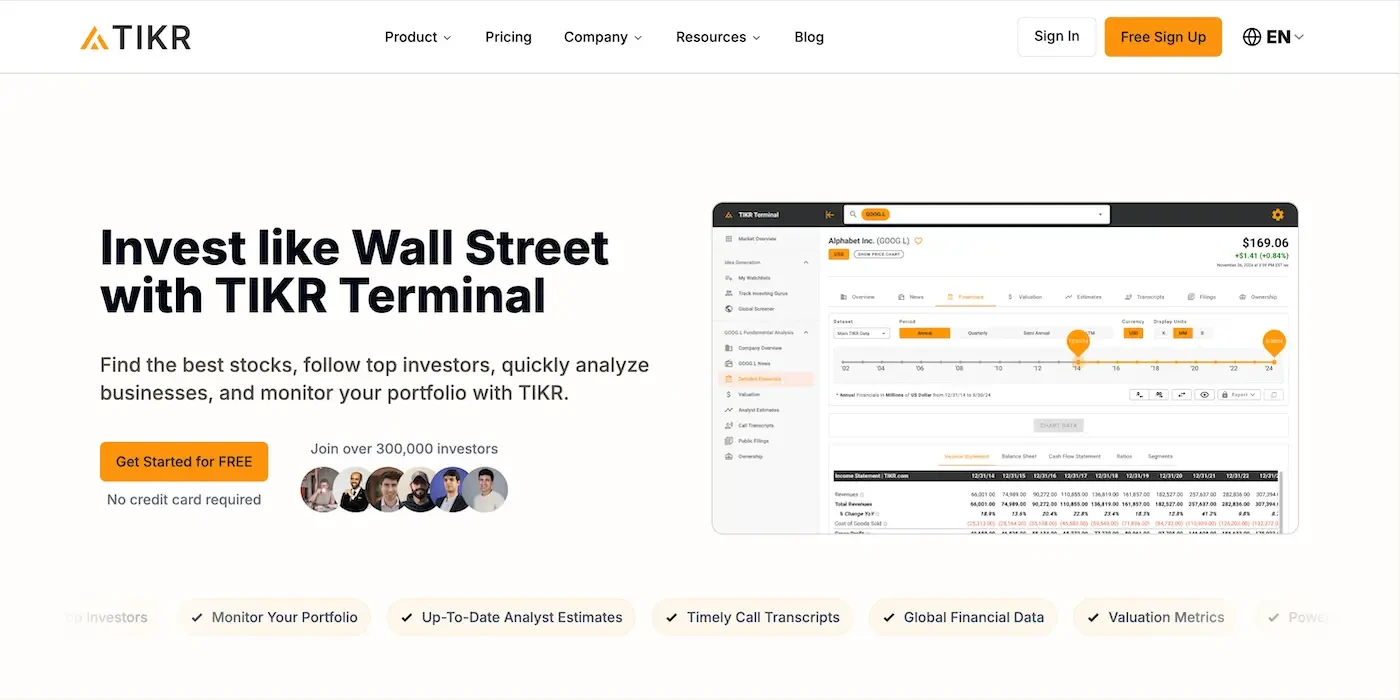
TIKR – Stock Research for a DIY Budget
1. Quick Snapshot
| Key Point | Details |
|---|---|
| Focus | Deep fundamental data, global stock screener, analyst forecasts, guru-portfolio tracking |
| Coverage | 100 K+ stocks across 92 countries & 136 exchanges |
| Platforms | Web (desktop & responsive mobile) |
| Pricing | Free • Plus $19.95/mo • Pro $39.95/mo (14-day money-back guarantee) |
2. Core Features
Global Data Hub
- Up to 20 years of financial statements and ratios powered by S&P Global Capital IQ.
- 5 years of forward Wall Street estimates on 100 + metrics (revenue, EPS, FCF, ROE, etc.)
Powerful Stock Screener
- Filter 100 K + equities on valuation multiples, growth rates, margins & analyst targets across 92 markets
Interactive Valuation Models
- Build or tweak DCF & other valuation templates in minutes, no spreadsheet required
“Super-Investor” Tracking
- See buys/sells from 10 000 + hedge-fund & insider portfolios (global 13F-style data) for idea generation
Watchlists & Portfolio Monitor
- Create watchlists or manual portfolios and get curated news, filings & transcript feeds for each holding
3. Pros 🚀
- Institutional depth at retail pricing – 20-year history & analyst data for <$40/mo beats many rivals.
- True global reach – research ADRs, Europe, Asia EM and more in one dashboard.
- In-browser DCF builder – run fair-value scenarios without Excel.
- Guru-holdings lens – follow Buffett-style “super-investors” worldwide for fresh ideas.
4. Cons ⚠️
- No live broker sync or trading – portfolios are watch-only, you’ll track, not execute.
- Charting is fundamentals-first – limited technical indicators compared with platforms like TradingView.
- Web-only – there’s no dedicated mobile app yet (site works on mobile browsers).
- Free plan U.S.-only & 5-year history – global data and long histories require Plus or Pro.
5. Ideal For ✅
Fundamental-driven investors, analysts, CFA candidates and value hunters who need institutional-quality data, long histories and analyst forecasts without Bloomberg-level costs. Perfect for those researching international stocks or tracking hedge-fund moves.
TIKR packs Bloomberg-like depth—global coverage, analyst forecasts, interactive DCF, guru tracking into a browser-based tool priced for individual investors. If your edge comes from digging into decades of fundamentals and spotting value world-wide, TIKR is a good choice.
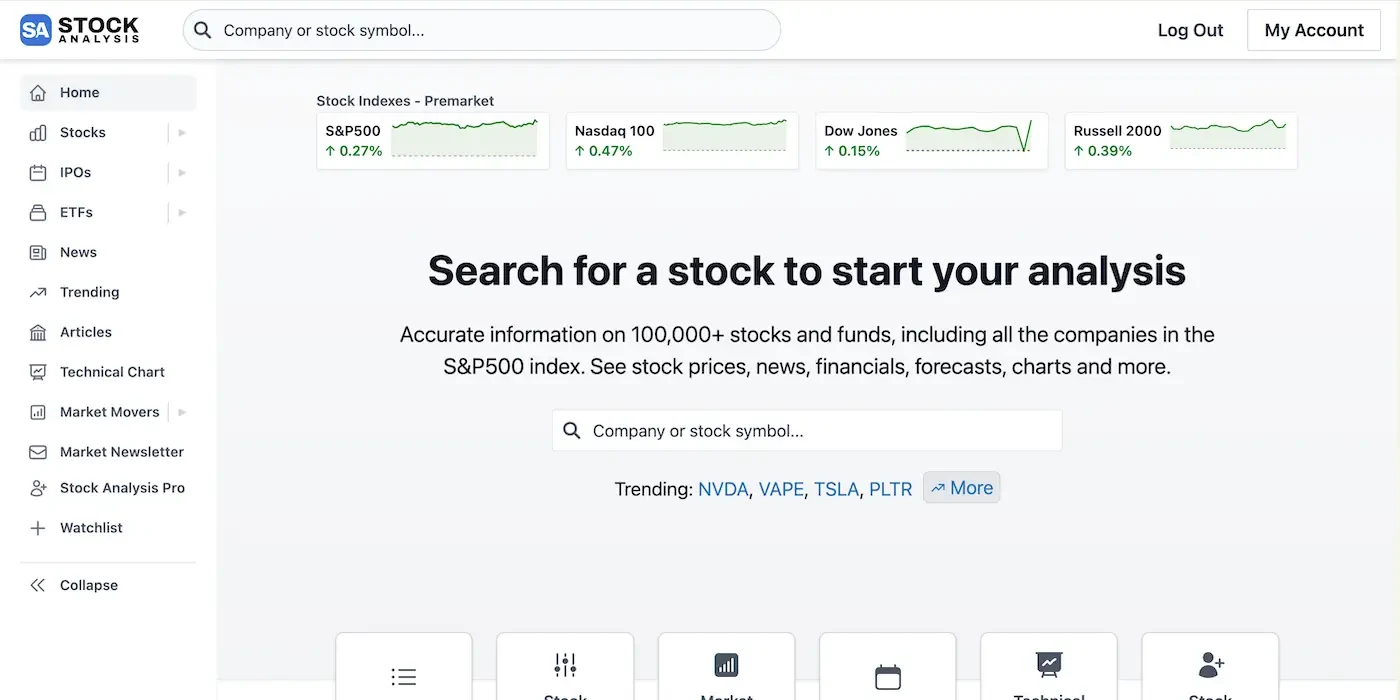
StockAnalysis.com – Free, Data-Rich Stock & ETF Research Hub
1. Quick Snapshot
| Key Point | Details |
|---|---|
| Focus | Real-time quotes, fundamental data, powerful screeners & basic portfolio tracking |
| Coverage | 100 K+ global stocks & ETFs (40-year financial history for Pro users) |
| Platforms | Web (desktop & mobile-responsive) |
| Pricing | Free • Pro $9.99/mo or $79/yr |
2. Core Features
One-Click Stock Profiles
- Real-time price, interactive chart, financials, ratios, analyst ratings & news, all on a single page.
Robust Free Screeners
- 250+ filters covering valuation, growth, dividends, momentum & technical factors.
- ETF & IPO screeners plus custom comparison tool (up to 10 tickers side-by-side).
Manual Portfolio & Watchlists
- Track gains/losses, dividend income and daily movers across multiple watchlists or simple portfolios.
Deep Fundamentals & Downloadable Data
- Up to 40 years of statements and 20+ valuation metrics with Pro, CSV export for DIY modeling.
Curated Market Tools
- Earnings calendar, sector leaders, top gainers/losers, trending tickers and educational articles.
3. Pros 🚀
- Completely free core experience – quotes, news, basic screener & financials at no cost.
- Huge data set – global coverage plus long history rare in a free platform.
- User-friendly UI – clean layout, dark mode, no login required for most features.
- Lightning-fast screening – 250+ criteria filter thousands of stocks in seconds.
- Low-cost Pro plan – unlocks 40-year histories, unlimited saved screeners & ad-free browsing for < $10/mo.
4. Cons ⚠️
- Manual-entry portfolio – no broker sync or automated transaction import.
- Basic analytics – lacks IRR, risk stats or tax reports, serves more as data hub than full tracker.
- Limited charts – good for quick visuals but not a replacement for TradingView-level technical analysis.
- Few proprietary insights – no AI scores or built-in valuations beyond standard ratios.
5. Ideal For ✅
Investors who need a fast, free source of stock & ETF fundamentals, robust screening, and quick comparisons perfect for research, homework, or supplementing broker tools. Great for students, value investors, and anyone migrating from Yahoo or Google Finance.
StockAnalysis.com delivers tons of high-quality data and screening power for free, with an optional Pro tier that remains budget-friendly. If you want quick financials, long histories and a flexible screener, all without paywalls or clutter.
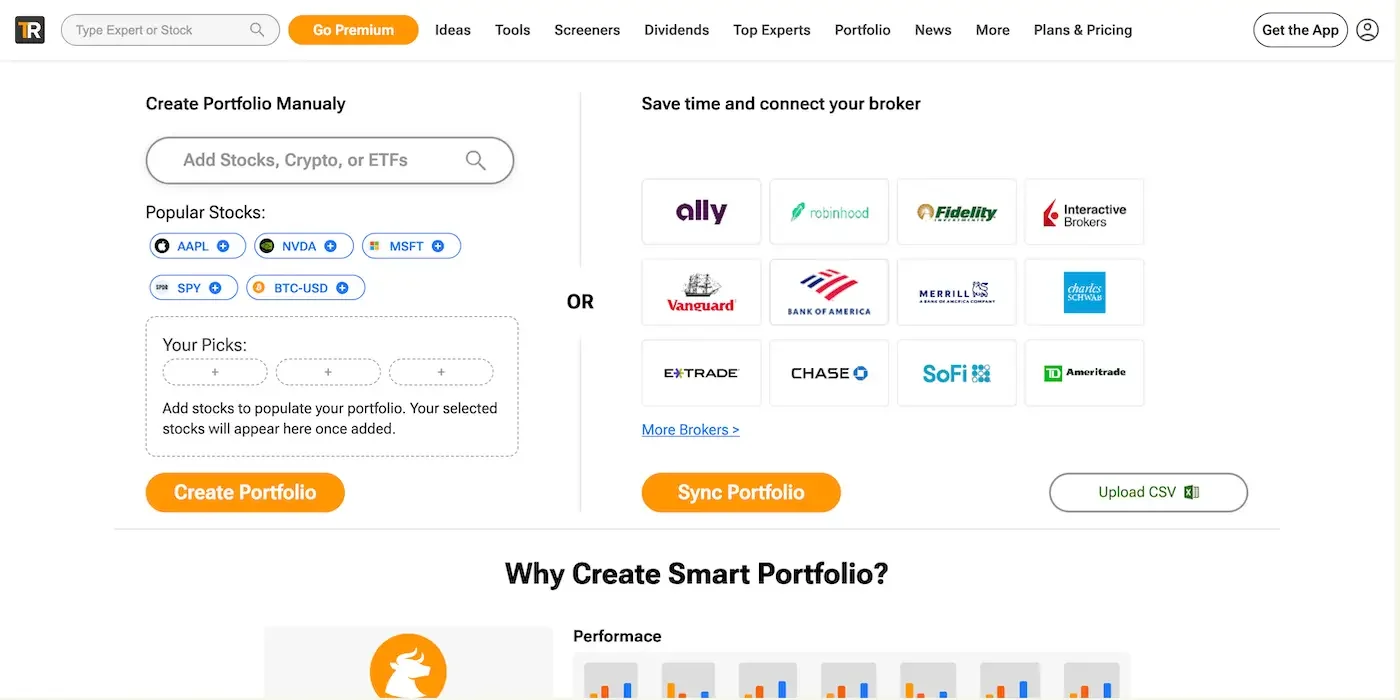
TipRanks – Analyst & Insider Sentiment Tracker With “Smart Score” Signals
1. Quick Snapshot
| Key Point | Details |
|---|---|
| Focus | Aggregates Wall Street analyst ratings, insider trades, hedge-fund moves & news sentiment |
| Coverage | 8 million+ analyst calls • 50 K+ global stocks • insider filings & hedge-fund 13F data |
| Platforms | Web • iOS • Android |
| Pricing | Free • Premium ≈ $29.95/mo • Ultimate ≈ $49.95/mo (frequent 30–40% discounts) |
2. Core Features
Smart Score (1-10)
- AI-weighted signal that blends analyst consensus, insider trades, hedge-fund moves, fundamentals, technicals and news sentiment.
Analyst Ratings + Accuracy
- Shows price targets, EPS forecasts and each analyst’s track record, so you can focus on calls with proven success.
Insider & Hedge-Fund Tracking
- Real-time alerts when CEOs, directors or top funds buy or sell shares.
Smart Portfolio
- Sync or enter holdings manually to receive Smart Scores, downgrade warnings and news tailored to your positions.
Idea Screeners
- Quick lists such as “Top Smart Score Stocks,” “Top 25 Analysts’ Picks,” dividend ideas and penny-stock filters.
Custom Alerts
- Email or push notifications for rating changes, insider trades, price moves or fresh high-conviction ideas.
3. Pros 🚀
- Data consolidation – analyst calls, insider trades, hedge-fund filings & sentiment all in one dashboard.
- Accountability – ranks every analyst & blogger by historical performance so you can weigh opinions by proven accuracy.
- Actionable scores – Smart Score distills multiple signals into a simple 1-10 rating for quick idea vetting.
- Mobile-friendly – full-featured iOS/Android apps with portfolio sync and real-time push alerts.
4. Cons ⚠️
- Heavy paywalls – most granular data (full analyst lists, insider details, unlimited screeners) locked behind Premium or Ultimate.
- Subscription cost – $30–50 / mo can feel steep for casual investors.
- Black-box formula – Smart Score weighting is proprietary, you can’t tweak factors.
- Short-term bias – scores & targets focus on 12-month upside, less useful for very long-term investing.
- Limited fundamentals – lacks deep financial statements or custom valuation models, works best as a sentiment layer, not a full analysis suite.
- No trading / broker sync (orders) – portfolio connection is read-only, don’t expect execution or IRR calculations.
5. Ideal For ✅
Active investors, swing traders, and research-driven stock pickers who track analyst upgrades, insider buys and hedge-fund moves for idea generation or timing. Also valuable as a “second-opinion” tool for longer-term holders who want to monitor sentiment shifts in their positions.
TipRanks excels at telling you what the “smart money” is doing right now and how reliable those voices were in the past. If your strategy leans on analyst sentiment, insider confidence or hedge-fund trends, TipRanks’ Smart Score and alert system are hard to beat.
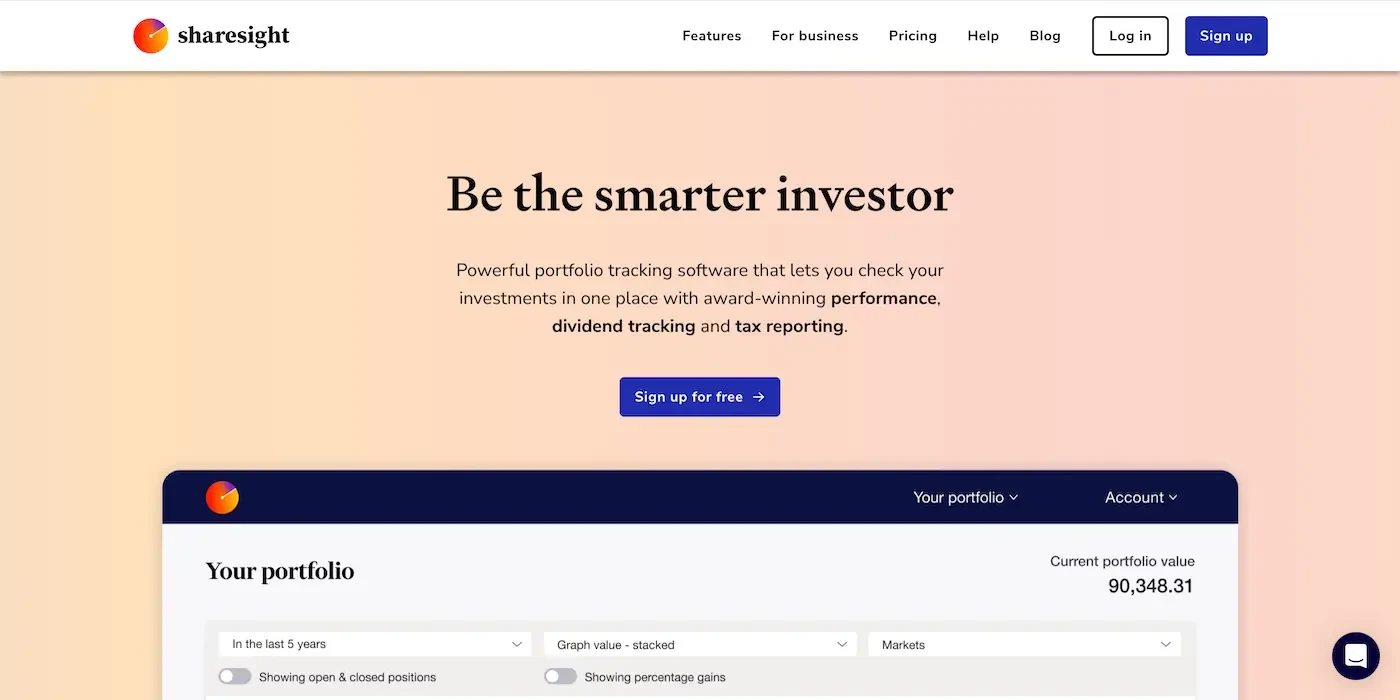
Sharesight – Portfolio & Tax Tracking in One Dashboard
1. Quick Snapshot
| Key Point | Details |
|---|---|
| Focus | Money-weighted performance, dividend & income tracking, multi-currency tax reporting |
| Coverage | 60+ global exchanges • stocks, ETFs, funds, crypto & custom assets |
| Platforms | Web • iOS • Android |
| Pricing | Free (10 holdings) • Standard $9.40/mo • Pro $24/mo • Premium $31/mo (annual billing) |
2. Core Features
True Performance Metrics
- Calculates money-weighted IRR and time-weighted returns, separating capital gains, dividends and currency effects.
Automatic Corporate Actions
- Applies splits, mergers and ticker changes automatically to keep historical data accurate.
Dividend & Income Suite
- Logs past payouts, projects future income and models DRIP reinvestment.
Tax-Ready Reports
- Generates capital-gains, taxable-income and distribution reports for AU, NZ, CA, UK and more, exportable to Excel.
Multi-Currency Tracking
- Automatically converts cash flows and shows FX gains or losses alongside home-currency weights.
Benchmark & Diversity Tools
- Compare performance against indices and view sector or country allocation with contribution analysis.
Custom Asset Support
- Add property, bonds or private equity to view your entire net worth in one dashboard.
3. Pros 🚀
- Accurate, transaction-level performance—no more spreadsheet errors.
- Hands-off dividend tracking with automatic DRP adjustments.
- Time-saving tax reports: capital-gains, FIF, and foreign income in a click.
- Global-investor friendly: multi-currency, 60+ exchanges, crypto & ADRs.
- Flexible pricing—start free, upgrade only when your portfolio grows.
4. Cons ⚠️
- No trading or research tools—purely tracking & reporting.
- Free tier capped at 10 holdings, serious users need a paid plan.
- Broker sync coverage strongest outside the U.S.—some American accounts require CSV import.
- Mobile app is view-only advanced reports available on desktop.
5. Ideal For ✅
Long-term investors, dividend collectors and global DIY investors who juggle multiple brokers, currencies or tax jurisdictions and need audit-quality performance and income records, minus the spreadsheet grind.
Sharesight replaces cumbersome spreadsheets with precise, tax-ready performance and dividend tracking across every asset and currency you own.
Snowball Analytics — Dividend-Focused Portfolio Tracker & Income Planner
1. Quick Snapshot
| Key Detail | What You Get |
|---|---|
| Focus | Dividend aggregation, income forecasting, back-tests & risk analytics |
| Coverage | Global stocks & ETFs + manual custom assets |
| Platforms | Web • iOS • Android |
| Pricing | Free trial • Starter $9.40/mo • Investor $17.50/mo • Expert $29.20/mo |
2. Core Features
Automatic Broker Sync
- Link major brokers or import via CSV / Google Sheets for hands-off position updates.
Dividend Dashboard & Calendar
- Displays past income, upcoming ex-div and pay dates, yield-on-cost and monthly or annual totals.
Dividend Safety Rating
- Proprietary score that flags payout risk by analyzing earnings, payout ratio and cash-flow coverage.
Strategy Back-Tester
- Simulates dividend portfolios over decades to gauge income growth, total return and drawdowns.
DRIP Analyzer
- Illustrates the compounding boost you get from automatically reinvesting dividends.
Risk & Performance Analytics
- Tracks IRR, time-weighted returns, beta, volatility, Sharpe ratio and crash-test results.
Multi-Currency Support
- Monitors FX gains or losses and converts payouts to your base currency.
3. Pros 🚀
- Built for dividend investors – all the income metrics mainstream trackers skip.
- End-to-end workflow – track, forecast, back-test and optimize dividends in one place.
- Broker aggregation – reduces spreadsheet work, supports major U.S. & EU brokers plus manual options.
- Advanced risk tools – Beta, VaR-style crash tests and allocation heatmaps keep you diversified.
- Continuous improvements – fast-moving roadmap driven by an active user community.
4. Cons ⚠️
- Niche orientation – less useful if dividends aren’t your priority.
- Still maturing – newer platform means occasional UI quirks or missing edge-case brokers.
- Web UI can feel busy to first-time users, learning curve for full analytics set.
- Dividend Safety algorithm is proprietary (no custom weighting).
- No built-in equity research beyond payout data, pair with a fundamentals tool for full analysis.
5. Ideal For ✅
Dividend-growth and passive-income investors who want one dashboard to consolidate brokers, project future income and stress-test payout safety. Perfect for FIRE planners, retirees and anyone obsessed with monitoring their monthly dividend “paycheck.”
Snowball Analytics fills a gap few platforms tackle: deep, actionable dividend intelligence. If your investing happiness is measured in monthly income and compounding snowballs, this tool outclasses generic trackers
Portfolio Dividend Tracker (PDT) — Analytics & Community for Dividend Investors
1. Quick Snapshot
| Key Detail | What You Get |
|---|---|
| Focus | Deep performance analytics, dividend aggregation, and investor community sharing |
| Coverage | Global stocks, ETFs + manual custom assets (crypto, REITs, etc.) |
| Platforms | Web (mobile-responsive) |
| Pricing | Free trial • Pro $7.50 / mo (single paid tier, billed annually) |
2. Core Features
Multi-Broker Aggregation
- Consolidate every account or import via CSV / Google Sheets, into a single, auto-updated dashboard.
Money-Weighted & Time-Weighted Returns
- View IRR, CAGR and performance breakdown across capital gains, dividends and currency effects.
Dividend Suite
- Includes payout calendar, Personal Annual Dividend Income (PADI), yield-on-cost and long-term income charts.
Risk & Allocation Metrics
- Provides portfolio beta, volatility, turnover, sector and country heat maps plus contribution analysis.
Portfolio “Time-Travel”
- Rewind any date to inspect historical allocations and past decisions for learning and review.
Community Sharing
- Opt-in to share anonymized portfolios, discuss strategies and benchmark against crowd averages.
3. Pros 🚀
- Professional-grade analytics normally found in costly software.
- Read-only community sharing delivers crowd insight without revealing personal identity.
- Flat, affordable pricing—one Pro tier at ≈ $7.50 / month for unlimited portfolios & holdings.
- Granular performance breakdown lets you pinpoint exactly what drives returns.
- Google Sheets sync offers automation for brokers not directly supported.
4. Cons ⚠️
- Web-only—no dedicated mobile apps or push alerts.
- Europe-centric beginnings—U.S. broker sync coverage still catching up, CSV import works but takes effort.
- No built-in fundamental research or valuation models—pair with another tool for stock analysis.
- Learning curve—data-dense UI can overwhelm first-time users.
5. Ideal For ✅
Data-driven DIY and dividend investors who love dissecting portfolio performance, comparing strategies with peers, and visualizing income growth, especially anyone replacing complex spreadsheets with a richer, shareable dashboard.
Portfolio Dividend Tracker marries in-depth performance analytics, dividend intelligence, and a like-minded investor community in a single, affordable package.
DivTracker — Mobile-First Dividend Tracking & Income Alerts
1. Quick Snapshot
| Key Detail | What You Get |
|---|---|
| Focus | Real-time dividend tracking, income calendar & payout alerts |
| Coverage | U.S. & global stocks / ETFs (plus manual assets) |
| Platforms | iOS • Android (mobile only) |
| Pricing | Free • Pro $3.99 / mo • Ultimate $6.99 / mo |
2. Core Features
Dividend Calendar
- Shows upcoming ex-dividend and pay dates so you never miss a payout.
Broker Sync
- Securely links major brokers, positions update automatically without manual entry.
Income Dashboard
- Displays annual, monthly and daily dividend income while tracking yield-on-cost and growth.
Custom Alerts
- Push notifications for dividend increases, cuts or yield changes beyond your set thresholds.
Portfolio Overview
- Offers quick visuals on sector allocation, gains or losses, market value and watchlists.
News & Insights
- One-tap access to company headlines and key fundamentals such as yield, payout ratio and P/E.
3. Pros 🚀
- Easy set-up — broker sync imports holdings in seconds, manual entry optional.
- Low cost — full Pro tier is less than a latte per month.
- Investor-friendly alerts — ex-div reminders & dividend change push notifications.
- High user ratings — 4.7★+ on App Store & Google Play for reliability and UI.
4. Cons ⚠️
- Limited analytics — lacks IRR, tax reports, or deep risk metrics.
- U.S.-centric syncing — most non-US brokers require manual entry.
- Basic research tools — good for quick checks, not full fundamental analysis.
5. Ideal For ✅
Dividend investors who love monitoring income on the go and want effortless alerts without spreadsheets. Perfect for buy-and-hold investors tracking payouts across multiple U.S. brokers.
DivTracker delivers hassle-free dividend monitoring, intuitive income visuals and real-time alerts, right from your phone.
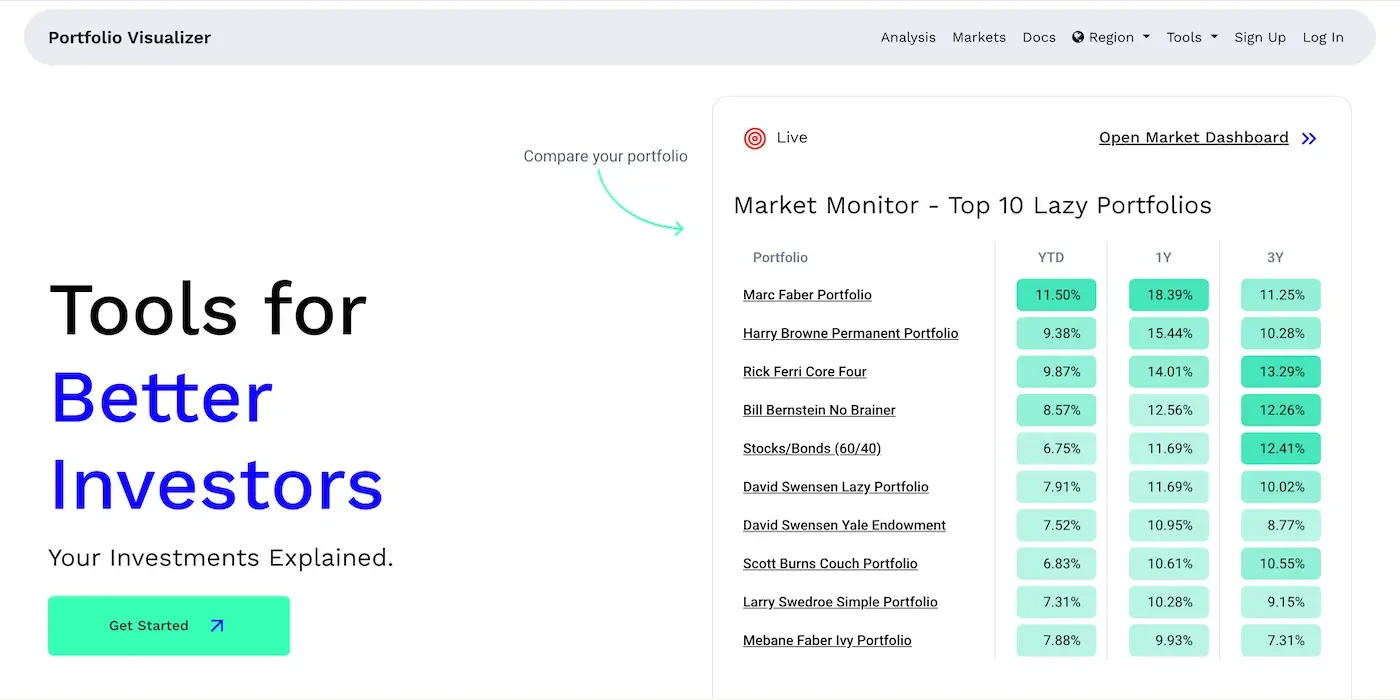
Portfolio Visualizer — Back-Testing & Asset-Allocation for Data-Driven Investors
1. Quick Snapshot
| Key Detail | What You Get |
|---|---|
| Focus | Historical back-testing, Monte Carlo simulations, factor analysis & portfolio optimization |
| Coverage | U.S. & international stocks, bonds, commodities, REITs, crypto indices + custom data uploads |
| Platforms | Web (desktop-first, no downloads) |
| Pricing | Free • Basic $19 / mo • Pro $39 / mo (annual discounts) |
2. Core Features
Asset-Allocation Back-Tester
- Back-test any portfolio to the 1970s, reviewing CAGR, drawdowns, Sharpe ratio, yearly returns and heat maps.
Factor & Regression Analysis
- Breaks down returns against Fama-French, momentum and custom factors to reveal performance drivers.
Monte Carlo Simulator
- Stress-tests retirement or FIRE plans by simulating thousands of future return paths with custom withdrawal rules.
Mean–Variance Optimization
- Builds efficient-frontier portfolios with constraints on asset weights, turnover or expense ratios.
Timing & Tactical Models
- Evaluates moving-average, momentum or risk-parity strategies in minutes without any coding.
3. Pros 🚀
- Institutional-grade analytics—factor regressions, efficient frontiers, Monte Carlo—free or low cost.
- Long historical data lets you back-test portfolio ideas across multiple market cycles.
- No-code interface—type tickers & weights, click “Analyze”, perfect for non-programmers.
- Custom asset uploads enable modeling of private strategies or new asset classes.
- Transparent documentation—every calculation is explained, great for learning modern portfolio theory.
4. Cons ⚠️
- Not a live tracker—no broker sync, trade execution or daily P/L views.
- US-centric default datasets, niche international data may require manual upload.
- Utilitarian UI—lots of forms & tables, can overwhelm beginners.
- Learning curve if unfamiliar with metrics like alpha, beta or efficient frontiers.
- Desktop-only experience—no native mobile app or push alerts.
5. Ideal For ✅
Evidence-based investors, advisors, FIRE planners and finance students who want to test, optimize and stress-test portfolios before committing real capital. Perfect for exploring “60/40 vs. 3-Fund vs. All-Weather” debates or calculating safe withdrawal rates.
Portfolio Visualizer puts quant-level back-testing and Monte Carlo tools at the fingertips of everyday investors, for a fraction of Bloomberg’s price. If you care about data-driven allocation, risk management and retirement probabilities rather than day-to-day trading, it is a powerful tool.
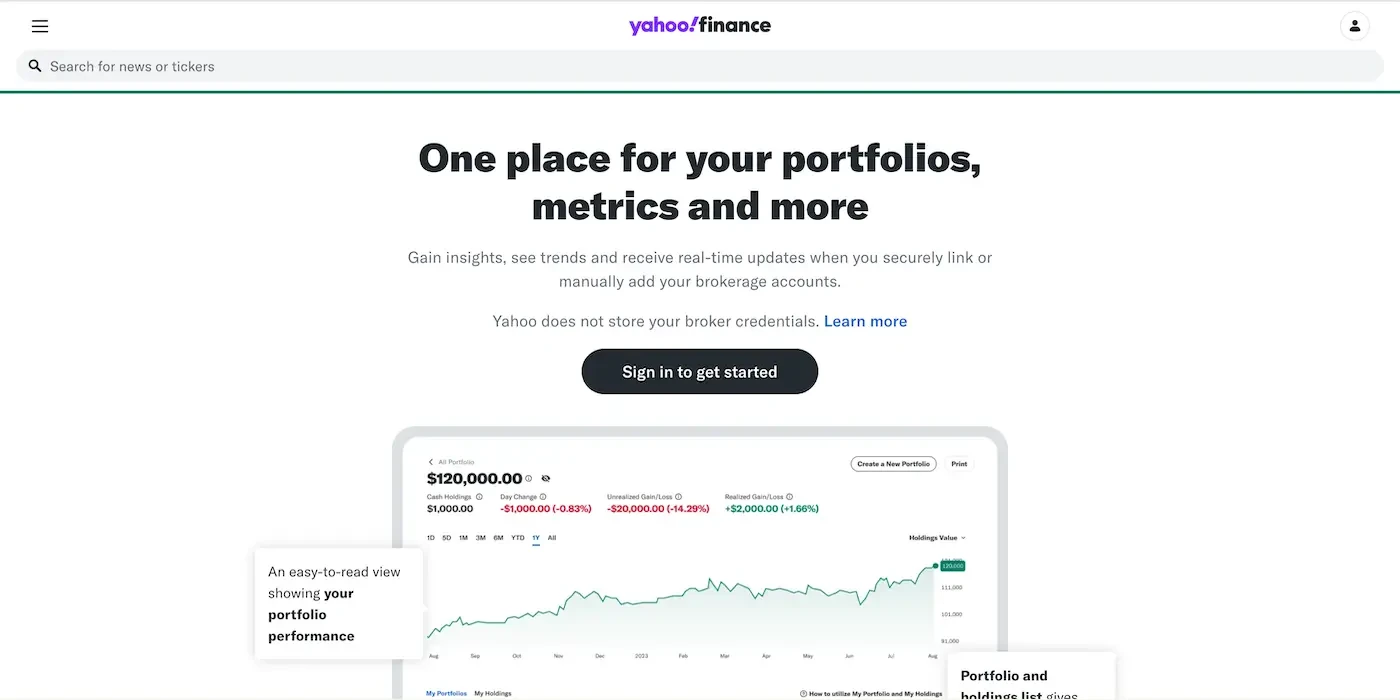
Yahoo Finance — Basic Portfolio Tracking for Every Investor
1. Quick Snapshot
| Key Detail | What You Get |
|---|---|
| Focus | Real-time quotes, curated news, watchlists & entry-level portfolio tracker |
| Coverage | 100+ global exchanges: stocks, ETFs, crypto, currencies & commodities |
| Platforms | Web • iOS • Android |
| Pricing | Free • Plus Lite $25/mo • Plus Essential $35/mo (14-day free trial) |
2. Core Features
Real-Time Quotes & Interactive Charts
- Free streaming prices from major global exchanges with interactive charts offering 100+ technical indicators.
My Portfolio Tracker
- Add holdings manually or link broker accounts via Plaid for automatic updates, tracks day gain, total return and allocation.
News & Video Hub
- Provides curated headlines, live market shows and earnings coverage integrated with each ticker you follow.
Screeners & Calendars
- Includes stock, ETF and mutual-fund screeners along with earnings, dividend and economic event calendars.
Plus Premium Tools
- Paid Plus tiers unlock fair-value indicators, a detailed portfolio risk report, trade-idea feeds and third-party research PDFs.
3. Pros 🚀
- Totally free core platform — real-time quotes, news and basic watchlists at zero cost.
- Ubiquitous coverage of stocks, ETFs, crypto and macro data in one site/app.
- Broker sync via Plaid or Yodlee keeps multiple accounts in one dashboard.
- Mobile apps rated 4 ★+ with customizable widgets and push alerts.
- Affordable Plus tiers bundle research reports, fair-value scores and ad-free experience for < $1/day.
4. Cons ⚠️
- Basic analytics only — no IRR, Sharpe or tax reports unless you upgrade to Plus Essential.
- Ad-heavy interface on the free tier may feel cluttered.
- No advanced valuation or AI tools — geared toward snapshot info, not deep modelling.
- Portfolio tracker is read-only — no trading or detailed diversification stats.
- Limited international fundamentals beyond five-year history for free users.
5. Ideal For ✅
Everyday investors and casual traders who need quick quotes, breaking news and a simple portfolio snapshot or anyone graduating from Google Finance/Yahoo classic but not ready for premium analytics platforms.
Yahoo Finance remains the go-to free portal for real-time market data, headline news and a no-frills portfolio tracker. While power users will still pair it with specialized tools for deep analytics.
FAQ – Choosing the Right Koyfin Alternative
What’s the biggest difference between Koyfin and its alternatives?
Koyfin excels at real-time charts and macro dashboards, but most alternatives focus on other strengths like broker syncing, deep dividend tools, tax reports, or lower pricing so the best choice depends on the gap you’re trying to fill.
Is there a completely free Koyfin alternative?
Yes. Platforms such as StockAnalysis.com, Yahoo Finance, and the free tiers of PinkLion, Ziggma, and TradingView let you research and track portfolios without paying, although advanced features may be locked behind paid plans.
Which alternative offers automatic broker syncing?
PinkLion, Sharesight, Snowball Analytics, Ziggma, TipRanks (read-only), and Portfolio Dividend Tracker all connect to brokers via Plaid or similar services, so your holdings update automatically.
What’s the best option for dividend investors?
Snowball Analytics, PinkLion, Portfolio Dividend Tracker, and DivTracker provide payout calendars, forward-income projections, and yield-on-cost tracking that go far beyond Koyfin’s basic dividend data.
I need deep historical data. Who provides the longest look-back?
PinkLion offers up to 30 years of financials across 92 markets, while Portfolio Visualizer supplies data back to the 1970s for back-testing. Koyfin’s Premium plan goes back 20 years on many metrics, but these alternatives may be cheaper or include different datasets.
Which tool is the cheapest for serious portfolio analytics?
PinkLion’s Strategist plan ($5.50 / mo) and DivTracker Pro ($3.99 / mo, mobile-only) are the lowest-cost options that still include broker sync and robust analytics. Ziggma Starter ($6.99 / mo) is another budget-friendly pick.
Can I export data to Excel or via API like I can with Koyfin Premium?
TIKR Pro, Portfolio Visualizer Pro, and Sharesight offer CSV or Excel exports. API access is available from Portfolio Visualizer Pro and Koyfin Premium; most low-cost trackers don’t yet expose an API.
Do any alternatives have native mobile apps?
Yes. Simply Wall St, TipRanks, Sharesight, DivTracker, Snowball Analytics, Yahoo Finance, and PinkLion (mobile-responsive web) all provide on-the-go access; DivTracker is mobile-first.
Can I migrate watchlists or data from Koyfin to another platform?
Most services let you import tickers via CSV. Export your Koyfin watchlist as a CSV file, then upload it to the new platform’s import wizard or copy-paste the symbols.
How do I decide which alternative is right for me?
List the features you actually use charts, broker sync, dividend tracking, options data, back-testing and match them against each platform’s strengths. Start with free trials; many tools offer 7–14 days of full access so you can test-drive before committing.