Alpaca Trading Portfolio Tracker (2025 Guide)
Alpaca’s paper trading is great for testing strategies, but lacks portfolio insights. Learn how a dedicated tracker like PinkLion adds performance metrics, risk analysis, and AI optimization to boost your trading edge.

Alpaca’s API-first brokerage makes algorithmic trading and paper testing accessible for retail investors. But if you're running a test strategy or trading crypto and stocks together, the default Alpaca dashboard likely isn't enough. In this guide, we’ll explore Alpaca’s native portfolio features, their limitations, and how tools like PinkLion can supercharge your paper trading insights.
What Alpaca Offers for Paper Trading
Alpaca is known for commission-free trading and a developer-friendly API. Its paper trading environment mirrors real markets and provides a valuable sandbox for refining strategies.
Highlights:
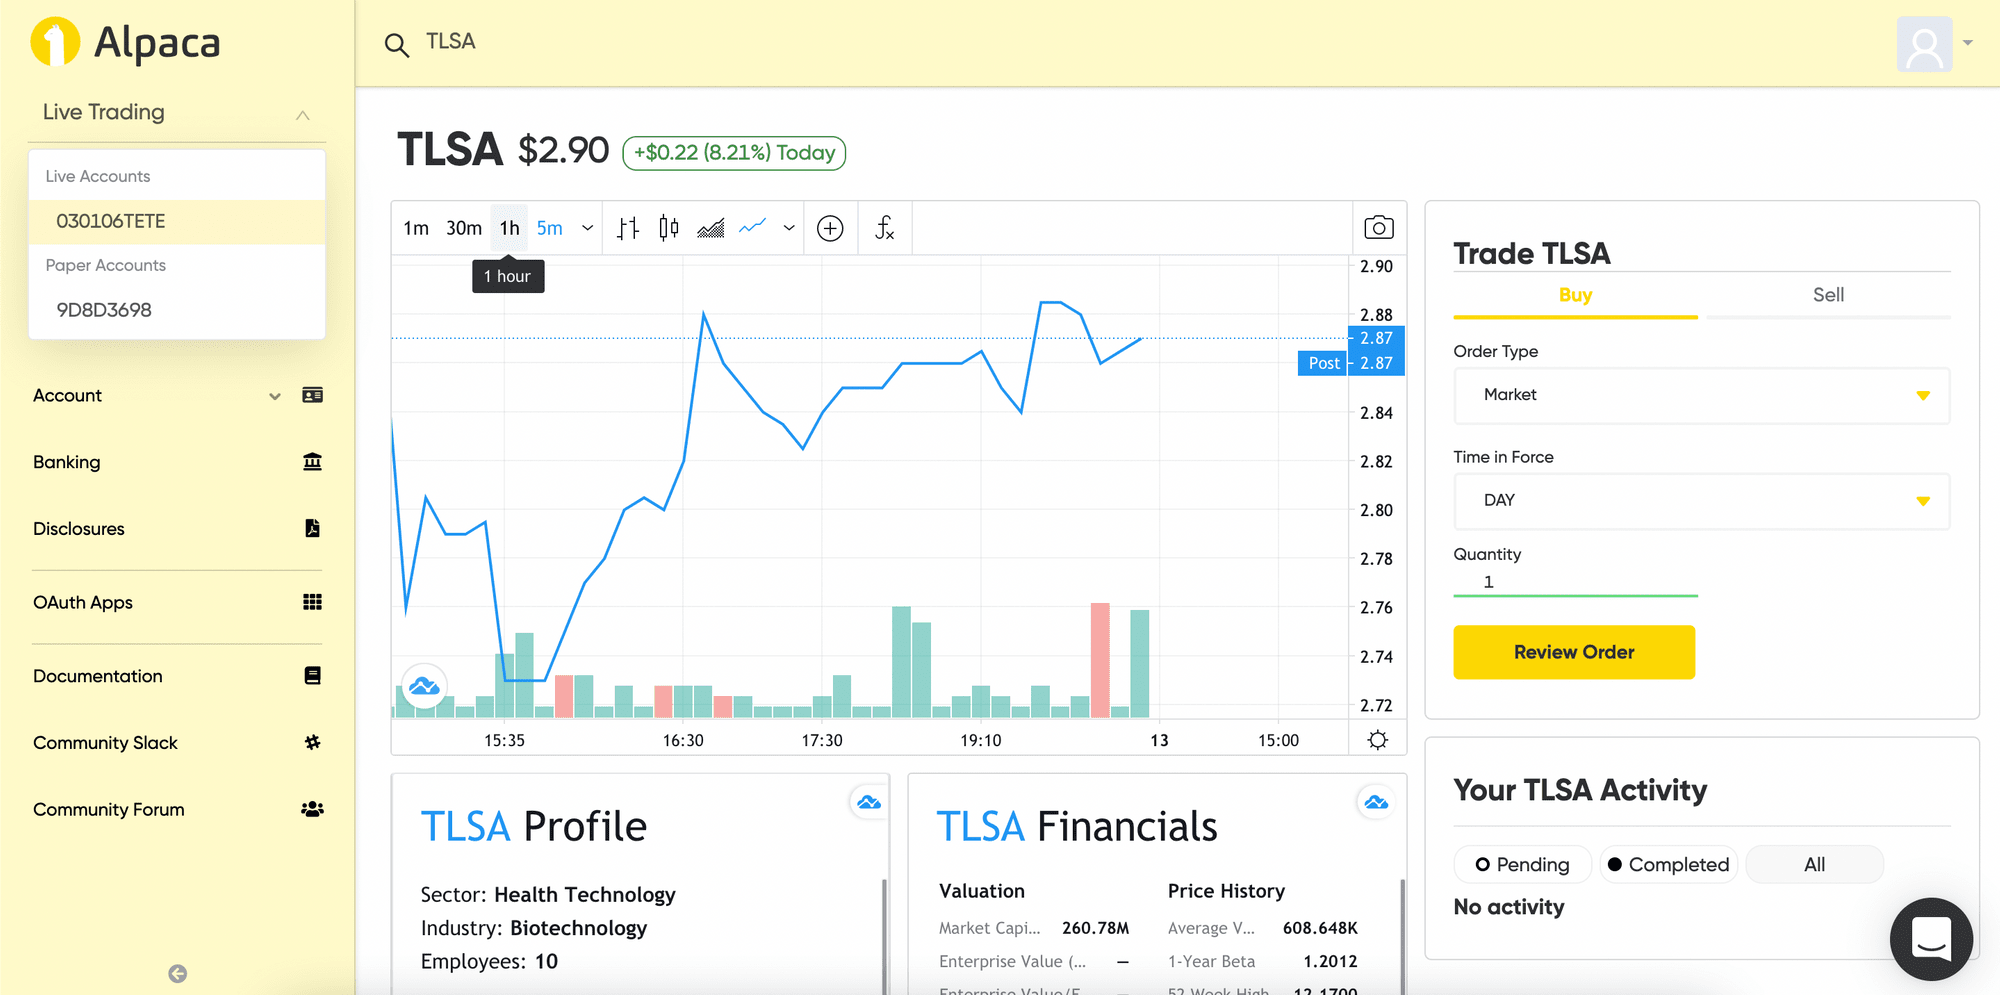
- ✨ Real-Time Market Simulations: Alpaca simulates live quotes and updates your portfolio value in real time, reflecting market moves instantly.
- 🚀 API Access: You can automate strategies via API, perfect for testing bots or systematic approaches without risking real money.
- 🏦 Dedicated Paper Account: Every user gets a separate $100,000 virtual portfolio, resettable at any time.
- 🔢 Stock + Crypto: Paper trade both stocks and select cryptocurrencies in the same environment.
- 📈 Basic Dashboard: Track holdings, order history, unrealized gains/losses, and buying power with a clean web interface.
While these features are great for building and executing test trades, they don't provide deeper analysis or long-term portfolio insights.
Where Alpaca Falls Short
Despite its strengths, Alpaca's paper trading tools are designed more for execution than evaluation.

Key Limitations:
❌ No Diversification Breakdown: No visual or data-driven sector/asset-class allocation.
❌ No Scenario Modeling: You can’t run stress tests or simulate what-if allocations.
❌ Alpaca-Only Data: Doesn’t aggregate holdings from other brokers or wallets.
❌ No Benchmarks or Risk Metrics: No comparison against S&P 500 or insights like Sharpe ratio or drawdown.
❌ No Dividend or Income Tracking: Paper accounts don’t simulate dividends or income projections.
❌ Basic Performance View: Lacks time-weighted returns, monthly performance trends, or IRR calculations.
In short, Alpaca shows what’s happening today, but not why it's happening or how to improve your strategy.
What a Portfolio Tracker Adds (Like PinkLion)
Connecting Alpaca to a portfolio analytics platform transforms your test trades into a learning experience.
Benefits:
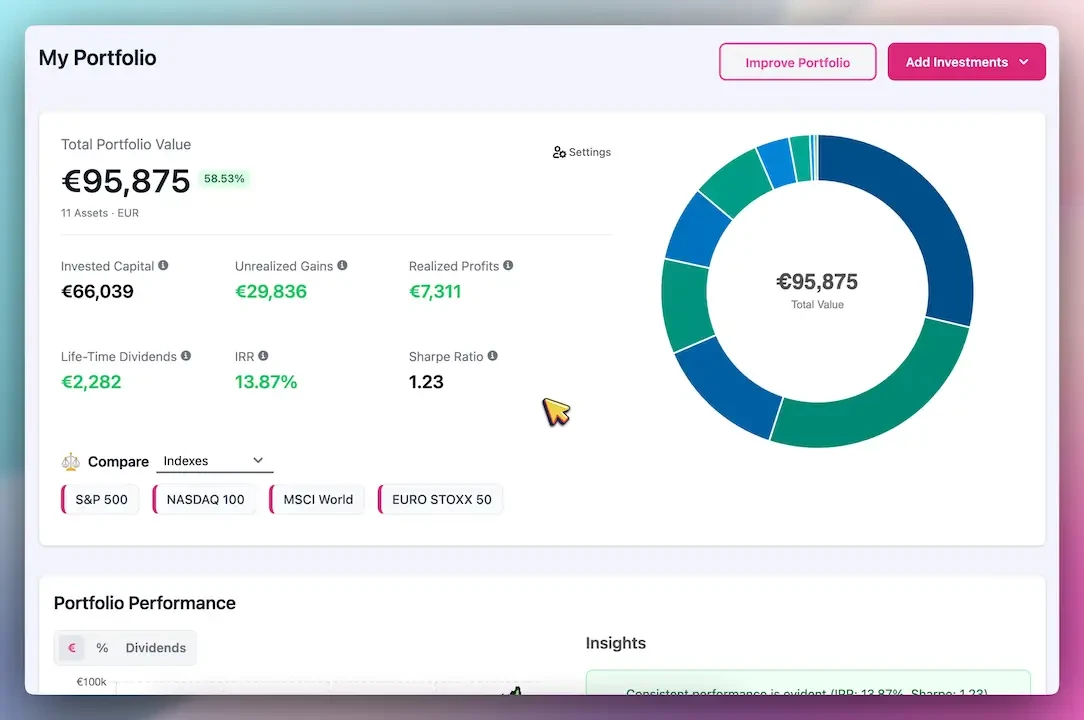
- 🔐 Unified View: Aggregate holdings from Alpaca, Coinbase, Vanguard, and more in one dashboard.
- 🔄 Advanced Metrics: View IRR, volatility, drawdown, Sharpe ratio, and time-weighted returns.
- 🤔 What-If Simulations: Test portfolio changes or stress events like 2008 or COVID.
- 🌍 Diversification Checks: See overexposure by sector, asset type, or region.
- 🤖 AI Optimization: Get recommendations to improve yield, reduce risk, or boost performance.
- 📆 Income Forecasting: Estimate future dividends or crypto income and build payout timelines.
This additional layer of intelligence makes paper trading feel like running a real portfolio with tools that support better decision-making.
Alpaca vs PinkLion: Feature Comparison
To summarize the differences, here’s a side-by-side look at what Alpaca’s paper trading platform provides versus what the PinkLion portfolio tracker adds on top:
| 🔍 Feature | 🧪 Alpaca Paper Trading | 🦁 PinkLion Portfolio Tracker |
|---|---|---|
| Asset Classes Supported | U.S. stocks, ETFs, and select crypto only (Alpaca accounts only) | Stocks, ETFs, crypto, cash, pensions—multi-broker, unified view |
| Real-Time Updates | Yes — live price simulation & instant paper trade feedback | Daily or on-demand syncs, near real-time for connected brokers |
| Multi-Account Aggregation | No — Alpaca-only view (live or paper) | Yes — aggregate Robinhood, Coinbase, pensions, wallets, etc. |
| Performance Metrics | Basic unrealized P/L and cost basis | TWR, IRR, cumulative performance over time |
| Diversification Analysis | None — no sector or correlation data | Sector, region, asset class, and correlation matrix |
| Risk Metrics | Not available | Sharpe, beta, max drawdown, volatility, risk alerts |
| Scenario Simulation | None — no stress testing or virtual rebalancing | Simulate 2008 crash, rate hikes, allocation changes |
| AI Portfolio Optimization | No — fully manual trading | Yes — goal-based AI suggestions to optimize returns or reduce risk |
| Income & Dividend Forecasting | No — paper trades ignore dividends | Yes — yield projection, payout calendar, compounding visuals |
| Trading & Execution | Yes — execute live and paper trades via API or UI | No — read-only insights, no trade execution |
How to Connect Robinhood to PinkLion
Step-by-step guide:
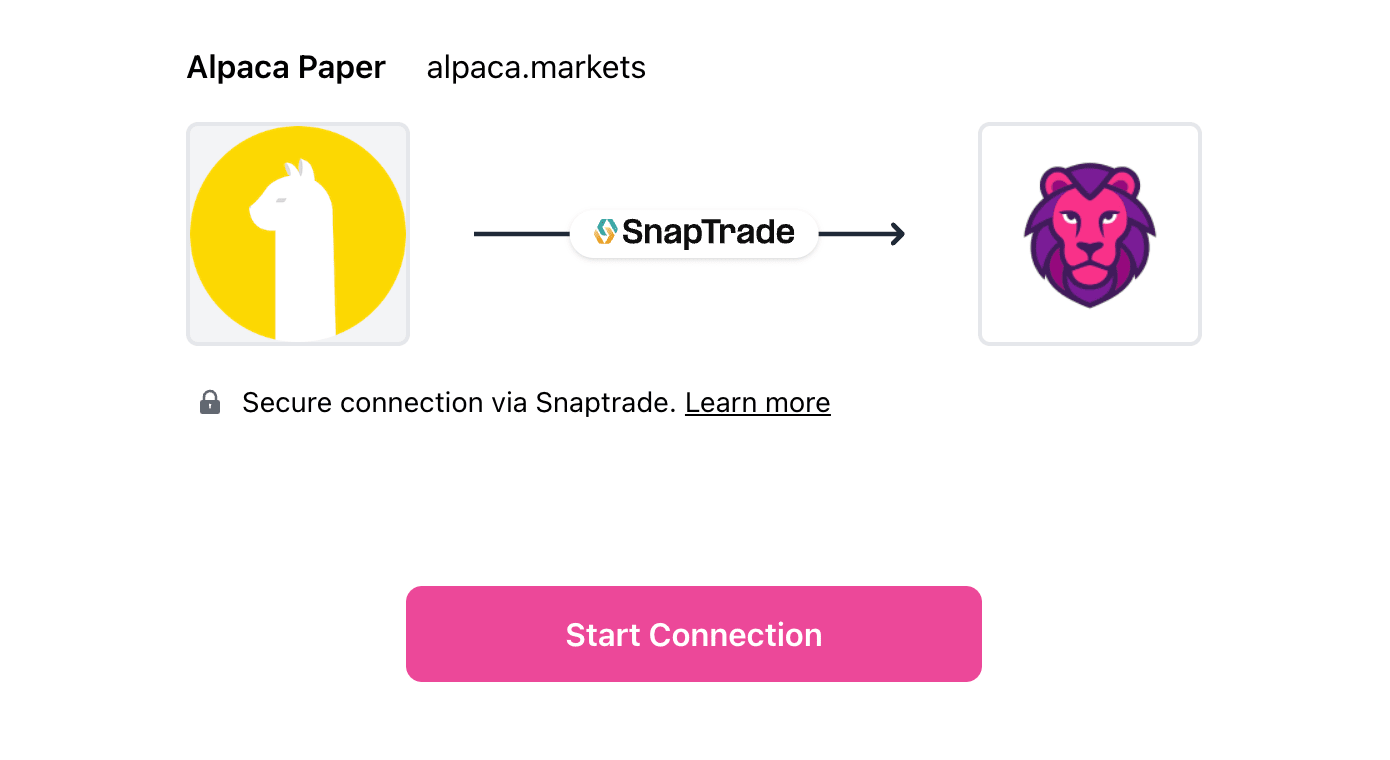
- Sign up at pinklion.xyz
- Go to Broker → Connect Broker
- Choose Alpaca Trading → Confirm Synchronization
- Immediately run an AI optimization or stress test
Best Practices for Alpaca Paper Traders
- 🔄 Rebalance Periodically: Don’t let your test portfolio drift unintentionally.
- 🌍 Diversify: Use PinkLion to avoid hidden concentration risks.
- ⚖️ Stress-Test Your Strategy: Simulate past crashes or bull runs.
- 🤖 Treat Paper Like Real: Build discipline and track your habits.
- 🚫 Remember Simulation Gaps: No slippage, emotions, or real dividends.
Final Thoughts
Alpaca is a brilliant sandbox for coding, testing, and refining trading ideas. But to analyze your portfolio like a pro, you need deeper insights.
PinkLion fills in those gaps with analytics, income forecasting, diversification checks, and AI planning. You can connect Alpaca’s engine with PinkLion’s intelligence to gain the complete experience: fast execution + deep feedback.
For retail investors and strategy testers, this combo offers the best of both worlds: the code-driven precision of Alpaca and the smart oversight of PinkLion.