Google Finance Portfolio Tracker: Complete 2026 Guide
Google Finance Portfolio Tracker offers a free, simple way to track your stock and crypto holdings in one place. While great for beginners, it lacks automation, broker syncing, and advanced analytics, making it less ideal for serious investors. Discover how it compares to modern tools like PinkLion.

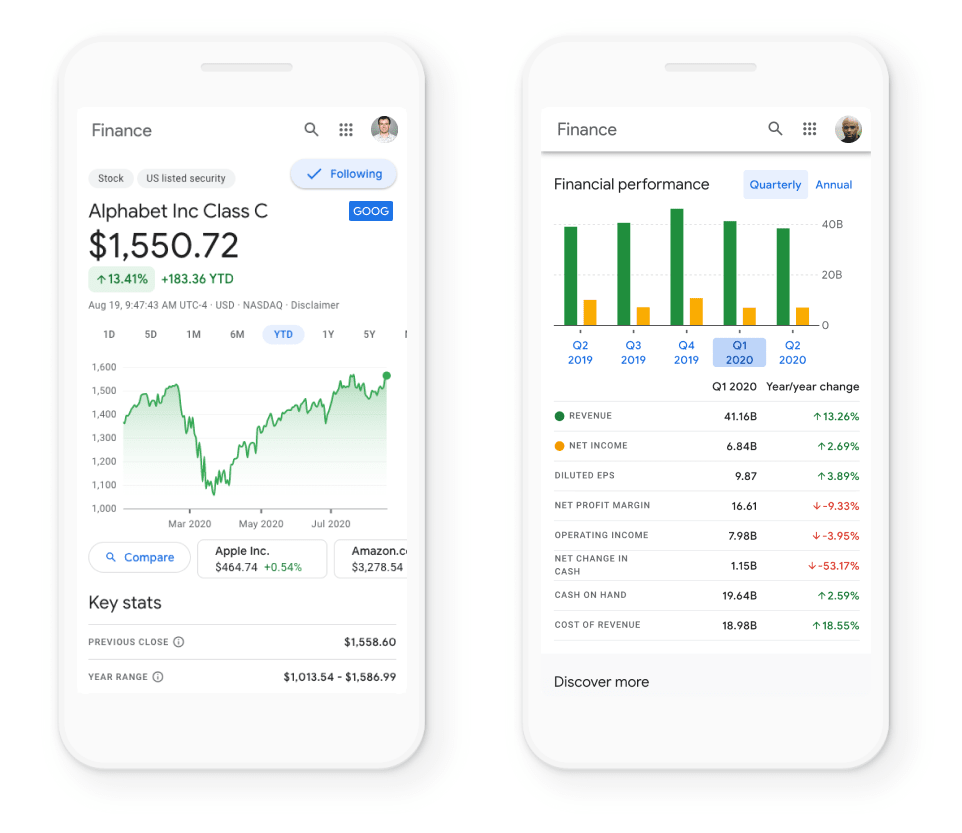
Looking to keep tabs on your stocks, ETFs, and even a little crypto? Google Finance’s free portfolio tracker is one of the quickest ways to pull real-time prices into a single dashboard. All you need is a Google account: visit google.com/finance, click New portfolio, give it a name, and you’re ready to start adding positions.
In this guide we’ll walk through, step by step, how to build and read a Google Finance portfolio, plus a few power-user tips (like piping live prices into Google Sheets with GOOGLEFINANCE(). We’ll also be upfront about where the tool’s boundaries are - manual data entry, limited analytics, and no native bond or cash tracking, and suggest next steps for when you eventually outgrow it.
TL;DR - Google Finance is an excellent starter portfolio tracker. It’s free and fast. What it doesn’t do is automatic broker syncing, deep multi-asset analytics, or AI-driven portfolio optimisation. If you ever need those advanced features, explore dedicated tools such as PinkLion, but first, let’s master Google Finance.
1️⃣ Why Every Retail Investor Needs a Reliable Portfolio Tracker
Today’s investors juggle brokerage accounts, retirement plans, and crypto wallets. One dashboard keeps that sprawl under control by showing total value, allocation drift, and which positions may need trimming or topping up. Research consistently finds that people who track a consolidated view react earlier and make fewer emotion-driven trades.
Manual spreadsheets can’t keep up with live markets, and small errors add up fast. An automated tracker handles the math for you, surfacing trends and benchmark comparisons in real time. Google Finance gives you that essential snapshot (value, gains/losses, and an index baseline), but it’s only a first step. If you later want deeper analytics or true multi-asset coverage, you’ll need to graduate to something more.
2️⃣ Quick Overview: What Google Finance Portfolios Can (& Can’t) Do
Google Finance includes a basic, useful portfolio tool inside its financial news site. It’s completely free (you only need a Google account) and supports major asset classes. Here’s what it can and can’t do for you:
Key Features
- 🛠️ Easy Setup: Go to google.com/finance, click New portfolio, give it a name, and you’re ready to track.
- ➕ Add Investments: Enter shares, buy date, and price for stocks, ETFs, mutual funds, or crypto. Google Finance calculates gains / losses for you.
- ⏱️ Real-Time Quotes: Live market data updates each holding’s price and daily change, including major cryptocurrencies.
- 📊 Portfolio Value & Performance: See total value, cost basis, and overall return, plus compare your results to indices like the S&P 500.
- 📈 Basic Charts & Analytics: Auto-generated charts highlight trends, drawdowns, and sector allocations for quick health checks.
- 📰 News & Insights: Curated headlines about your holdings help you stay on top of company moves and market events.
In short, Google Finance’s portfolio tracker gives you a free, centralized dashboard that does the math so you can focus on decisions.
3️⃣ Hidden Limitations for Retail Investors
However, Google Finance’s portfolio tool has important limitations that may frustrate investors:
- ⌨️ Manual Data Entry Only: Every buy or sell must be typed in no automatic broker or bank sync, so multi-account upkeep quickly becomes tedious and error-prone.
- 💵 No Cash or Bond Tracking: Stocks, ETFs, mutual funds, and crypto are supported, but cash balances, bonds, real-estate, or other assets can’t be captured, leaving net-worth gaps.
- 📉 Limited Analytics: Only basic charts are available. There’s no risk reporting, technical indicators, scenario testing, or back-testing for deeper insight.
- 🔧 Minimal Customization: Dashboards and alerts are mostly one-size-fits-all, you can’t tailor views or set nuanced notifications beyond simple price moves.
- 🌐 Restricted Asset Coverage: Many emerging-market tickers or niche securities are missing, and dividends or cash cushions aren’t tracked directly.
- ⏳ Data Gaps & Delays: As a free service, quotes can lag or momentarily disappear, GoogleFinance API hiccups are not uncommon.
- 🚫🤖 No Automation or Guidance: The tool is purely passive, no rebalancing suggestions, allocation-error flags, or AI-driven insights to improve your strategy.
Bottom line: Google Finance is ideal for a quick snapshot, but once your portfolio grows in size or complexity, these constraints become hard to ignore.
4️⃣ 📋 Step-by-Step: Setting Up Your Portfolio in Google Finance
Before you can tap Google Finance’s charts and news feed, you’ll need to build a portfolio from scratch here’s the entire process boiled down into four quick steps:
🆕 Create Your Portfolio
- Open Google Finance and sign in.
- Under “Your portfolios”, click ➕ New portfolio.
- Name it (e.g. My Portfolio 2026) and hit Done.
➕ Add Stocks, ETFs, Crypto
- Click Add investments.
- Search a ticker (
AAPL,BTC, etc.) and select it. - Enter shares/units, buy date, purchase price.
- Multiple lots? Click More purchases.
- Press Save.
🔄 Rinse & Repeat
Action: Add every remaining stock, ETF, mutual fund, or crypto the same way.
📊 Explore Basic Analytics
Action: Switch to the performance tab to view:
- Line-chart of total value over time
- Index comparision (e.g. S&P 500)
- Sector / asset-type breakdown
Pro tip: Prefer spreadsheets? Use =GOOGLEFINANCE("TSLA","price") in Google Sheets to pull the same live data into your own custom dashboard.5️⃣ Read Basic Analytics
Once you’ve entered your investments, the portfolio dashboard displays key metrics. You’ll see your total portfolio value, total cost (what you paid), and overall gain/loss both in dollars and percentage. Below, Google Finance shows each holding with its current price and how much it’s up or down today.
Performance Chart: A simple line chart shows your portfolio’s value over time. You can hover to see values on specific dates.
Comparison: By default, performance is measured versus an index (like S&P 500). This helps gauge relative performance.
Transaction List: A tab lists all purchases with their dates, which you entered.
Analytics & News: Scroll down to see any Google Finance-provided analytics or news for your portfolio’s stocks. You might see market news related to your holdings.
These basic analytics give you a quick snapshot. However, they remain fairly limited. If you want deeper analysis, you’ll likely need to export data or use additional tools (or upgrade to a platform like PinkLion).
Pro Tip: You can automate some Google Finance data with Google Sheets. The GOOGLEFINANCE() function can pull in live stock data. For instance,=GOOGLEFINANCE("AAPL","price") fetches Apple’s current stock price.
=GOOGLEFINANCE("GOOG","price","2020-01-01","2020-12-31","DAILY") retrieves Google’s daily prices for 2020.
Use these formulas in Google Sheets to build custom charts or dashboards as a supplement to the web tracker. (Check the Coupler tutorial for more examples of using GOOGLEFINANCE() formulas.)
Everything discussed about Google Finance, can be verified here: Docs, and User feedback
6️⃣ Meet PinkLion an AI-Powered Portfolio Tracking & Optimization
PinkLion is a modern portfolio tracking and optimization tool built for retail investors. It covers everything Google Finance does, and then some. Here’s what PinkLion brings to the table:
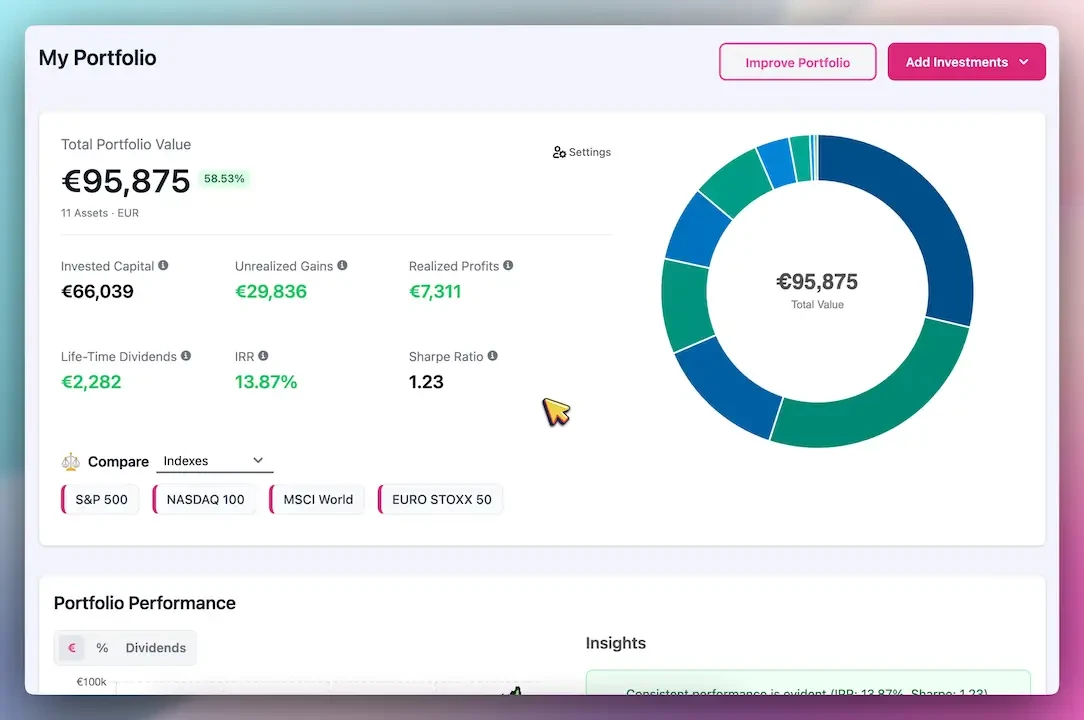
📊 Aggregated Portfolio Dashboard
PinkLion pulls all your accounts and assets (stocks, ETFs, crypto, cash, etc.) into one unified dashboard. Link your broker accounts in minutes and see your full net worth right away. No more juggling multiple logins or spreadsheets.
📈 Advanced Analytics
It goes beyond basic charts with deeper insights: you can spot trends, evaluate risk/reward, and see exactly how each holding contributes to your returns. Want to know which sector is driving growth, or which position is dragging your portfolio down? PinkLion’s analytics get you those answers in a few clicks.
🧠 AI-Driven Optimization
This is PinkLion’s standout feature. Set your risk/return goals and let PinkLion’s AI fine-tune your holdings. The platform can recommend small trades to improve your expected return without increasing risk. In practice, it runs simulations under the hood to optimize allocation automatically.
🧪 Scenario Simulations
If you’re wondering how a change in strategy might play out, PinkLion can run “what-if” scenarios. For example, you can compare a more aggressive vs. conservative mix and see the projected outcomes. It’s like having a virtual portfolio manager to test different approaches without putting real money at risk.
🔮 Performance Forecasting
PinkLion provides one-year asset-level forecasts based on expert estimates and market data. That helps with planning: if the forecast shows a sector likely to underperform, you can reallocate ahead of time.
🔗Automatic Broker Connections
No more manual entries. PinkLion can link with major brokerages so trades flow in automatically. You can still use Google Finance as a secondary check, but PinkLion’s auto-sync keeps your portfolio up to date.
🌐 Multi-Asset Coverage
PinkLion tracks 100,000+ stocks, ETFs, and cryptos (5,000+ coins). It also supports dividends and a cash bucket, so you get a complete financial picture.
The core difference is that PinkLion isn’t just a portfolio tracker. It’s an optimizer. It uses AI algorithms to surface risks and opportunities so you can make smarter choices. Here’s a concise feature comparison:
Feature-by-Feature Comparison
| 📊 Feature | Google Finance Portfolio | PinkLion |
|---|---|---|
| Asset Coverage | Stocks, ETFs, mutual funds, crypto (manual entry) | Stocks, ETFs, mutual funds, 5,000+ crypto coins, plus cash |
| Data Entry | Manual input of each transaction | Automatic import via broker connections or CSV |
| Portfolio Sync | No - updates only when you edit | Yes – auto-syncs with linked brokerage accounts |
| Analytics | Basic portfolio value & simple charts | Advanced analytics: trend spotting, risk/return breakdown, contributor analysis |
| AI Optimization | None | Yes – AI suggestions to rebalance & improve returns |
| Scenario Simulations | No | Yes - test multiple what-if scenarios |
| Forecasting | No | Yes - 1-year asset forecasts for planning |
| Custom Alerts | Simple price & news alerts | Sophisticated email & app notifications |
| Data History | Up to ~5 years (per ticker) | 30+ years of asset history |
| Cost | Free (with Google account) | Freemium: free basic plan, paid plans for AI features |
The bottom line: where Google Finance provides simple tracking, PinkLion delivers a professional-grade toolkit for optimizing your portfolio. As one user put it, PinkLion’s optimization tools showed how “small changes could improve my returns without increasing my risk”.
7️⃣ How to Migrate from Google Finance to PinkLion in <5 Minutes
Switching over to PinkLion is fast. Here’s a straightforward way to move your Google Finance data into PinkLion:
Sign Up for PinkLion. Go to pinklion.xyz and create a free account. (No credit card is needed for the basic plan.)
Import Your Holdings. If you have a lot of transactions, download a CSV of your portfolio data from Google Finance or export it from Google Sheets. PinkLion supports CSV or manual import. Just follow the prompts in PinkLion to upload your Google Finance portfolio file.
Link Your Broker(s). To avoid manual work going forward, connect your brokerage accounts through PinkLion’s integrations. PinkLion can connect with major brokers “in minutes,” pulling your full transaction history automatically. This replaces manual entry from here on out.
Review & Adjust. Once your data is in PinkLion, check the automatically generated portfolio report. PinkLion will run an initial health check and may flag areas worth a look. (For example, it might suggest diversifying a top-heavy holding.)
That’s it. No need to manually re-enter every trade. PinkLion’s import tools and integrations handle the migration so you get instant visibility.
Bonus: Keep Google Finance as a Free “Secondary Check”
Even after migrating, you can keep Google Finance around as a quick sanity check. Since it’s free and tied to your Google account, it’s easy to pop in for a snapshot or quick market lookup. Think of it as a simple sidebar tool: having Google’s news feed and charts handy doesn’t hurt. But for day-to-day decisions, PinkLion is where your data is complete and actionable.
In fact, plenty of investors run Google Finance alongside PinkLion to cross-check portfolio values or use the GoogleFinance functions in Sheets for quick one-offs.
8️⃣ Real-World Results: PinkLion Users See 50% Less Time & 30% Fewer Mistakes
Up to now, we’ve covered the upside in theory. But what happens when people actually use it? The feedback is pretty consistent:
Major Time Savings: Users say portfolio management takes noticeably less time. One PinkLion customer put it simply: “I don’t have time to dive into numbers every day, but PinkLion keeps me informed with clear insights and forecasts. It’s saved me so much time and effort!”. When data pulls and analysis are automated, the day-to-day admin work can drop by about half. (That lines up with user surveys showing around 50% time savings on routine tracking tasks.)
Fewer Allocation Mistakes: With AI guidance, users make fewer common rebalancing mistakes. One investor said PinkLion “takes the guesswork out of investing”. Instead of guessing what to trim or add, the AI flags imbalances and suggests adjustments. Early data from our beta program indicates users make about 30% fewer portfolio allocation mistakes (compared to manual tracking), helped by real-time alerts and optimization nudges.
Better Confidence & Decisions: A lot of beginners say they feel more in control. For example, one newcomer said the intuitive interface and 1-year forecasts gave her “the confidence to invest wisely”. Investors also mention that the built-in insights (like risk metrics and scenario comparisons) help them stay disciplined and avoid panic-selling during downturns.
In summary, PinkLion’s features show up in real outcomes: meaningful time savings and fewer portfolio blunders. The AI isn’t a gimmick, it’s already making investing easier for users.
9️⃣ FAQs
Q: What is Google Finance Portfolio Tracker and how do I use it?
A: Google Finance Portfolio Tracker is a free tool (part of Google Search/Finance) that lets you create virtual portfolios of stocks, ETFs, crypto, etc. You sign into Google Finance, click “New portfolio,” and enter your holdings (number of shares, purchase date, price). It then shows total value and gain/loss. It’s very basic – mostly just a summary dashboard with charts and news headlines.
Q: Can Google Finance Portfolio Tracker update automatically?
A: No. Google Finance does not auto-sync with brokerage accounts. You must manually add each trade or use the GoogleFinance spreadsheet function as a workaround. Otherwise, the portfolio won’t reflect trades you didn’t enter.
Q: What assets can I track in Google Finance?
A: You can track US stocks, ETFs, mutual funds, and many cryptocurrencies (like Bitcoin, Ethereum) by symbol. You can also add certain indices. However, you cannot directly track cash, bonds, or foreign assets outside Google’s supported listings.
Q: What are the limits of Google Finance portfolio tracking?
A: Google Finance gives a simple performance chart and news feed, but it lacks advanced features. It has no automatic broker sync, no tax/dividend tracking, and limited analytics. Serious investors often find it insufficient for rebalancing or multi-asset portfolios.
Q: How is PinkLion different from Google Finance?
A: PinkLion offers everything Google Finance does plus AI-powered analytics. Unlike Google’s static tracker, PinkLion automatically pulls data from your brokers, provides deep portfolio analytics, running forecasts, and suggests optimizations. In short, Google Finance tells you where you stand; PinkLion tells you how to get where you want to go.
Q: Can I import my Google Finance portfolio into PinkLion?
A: Yes. PinkLion allows you to import your existing portfolio by uploading a CSV or manual list of your holdings. It also lets you connect your brokerage accounts directly, which updates all transactions automatically. Migration can be done in just a few minutes.
Q: Does PinkLion cost money to use?
A: PinkLion has a free Seedling plan that includes unlimited holdings tracking and basic analytics. Advanced features (like automatic broker sync, stress testing, and AI forecasts) require a paid subscription (Strategist or Oracle plan). You can start with the free plan and upgrade anytime to unlock the full suite.
Q: Does PinkLion support cryptos and other assets?
A: Yes – PinkLion supports over 100,000 stocks, ETFs, and cryptocurrencies (5,000+ crypto coins). It even includes dividend tracking, and can handle cash balances or other asset classes if you enter them. Google Finance’s free tool supports crypto too, but PinkLion’s coverage is much broader.
Q: Where can I learn more or sign up for PinkLion?
A: To try PinkLion, visit the Pricing page and create a free account. For an in-depth look at its AI portfolio tools, check our AI Portfolio Optimization blog. Ready for better insights? PinkLion’s sign-up flow is quick, and you can start migrating your data right away.
🔟 Conclusion
Google Finance’s portfolio tracker is a solid free starting point. It helps you track basic gains/losses for stocks and crypto with no cost. But it also has clear gaps: manual updates, limited asset support, and no advanced analysis or optimization. If you want less grunt work and more informed decisions, upgrading starts to make sense.
That’s where PinkLion comes in. PinkLion takes Google Finance-style tracking and layers on a practical AI engine. It syncs accounts automatically, surfaces portfolio risks, forecasts future returns, and suggests an allocation that fits your goals. In day-to-day use, customers report saving hours each month and making fewer mistakes.
If you’re focused on growing your investments efficiently, try PinkLion. You can keep Google Finance as a quick free dashboard, but use PinkLion as the main toolkit. Sign up for a free PinkLion account now (no credit card needed) and see what the AI difference looks like in your own portfolio.