How to Analyze Market Trends: Essential Strategies for Investors
Learn how to analyze market trends with PinkLion. Discover key strategies to interpret data and make smarter investment decisions today.

Learning to read market trends is less about finding a crystal ball and more about building a repeatable process. It’s a craft. You start by looking at what the market has done in the past, connect those patterns to what's happening in the economy right now, and then—crucially—check your theory against real-time data like trading volume and investor sentiment.
Get this right, and you move from guessing to making calculated decisions. This guide will show you exactly how to do that using PinkLion’s suite of tools.
Your Guide to Analyzing Market Trends with PinkLion
Welcome to your practical, no-nonsense guide for decoding the stock market. Trying to make sense of all the noise can feel like drinking from a firehose, but it really boils down to understanding the story the data is telling. Instead of just reacting to the latest headlines, a structured analysis helps you see the bigger forces moving asset prices. The goal here is simple: build a repeatable process that gives you confidence in your calls.
Think of this walkthrough as your command center, with PinkLion as the main console. We’ll show you how sophisticated analysis isn't just for Wall Street anymore; it's accessible to every retail investor.
By the end, you'll know how to:
- Figure out if the market is generally heading up (bullish), down (bearish), or just treading water (sideways).
- Connect the dots between price charts and real-world economic drivers.
- Use volume and sentiment data to confirm if a trend has real strength behind it.
Seeing the Bigger Picture
It’s incredibly easy to get spooked by daily price swings. But stepping back to look at the long-term view is essential for keeping your cool.
For instance, despite all the crashes and corrections, the S&P 500 has delivered an average annual return of roughly 10.5% since it began in 1957. Those historical ups and downs are just part of the market's natural rhythm. The long-term trend, fueled by economic growth and companies making more money, has remained upward. Understanding this context is the foundation of smart trend analysis.
This is where the PinkLion dashboard comes in. It pulls everything into one place—your portfolio's performance, key market indicators, and news sentiment—so you can stop juggling a dozen browser tabs.

This unified view lets you instantly see how your holdings are behaving in relation to the wider market. No more guesswork.
Expert Tip: If you want to dive deeper into the fundamental concepts of market analysis, the folks at VTrader's comprehensive Academy offer some fantastic learning materials that build on these core ideas.
Before we get into the step-by-step process, let's summarize the foundational concepts we'll be working with. Think of these as the key pillars of any solid market trend analysis.
Core Principles of Market Trend Analysis
These three principles work together to give you a complete picture. With this framework in mind, let's start putting PinkLion's tools to work.
Spotting Long-Term Trends in Historical Data

To make sense of the market, you first have to learn how to read the story told by historical data. The daily chatter—all those little price dips and spikes—is mostly noise. Real insight comes from seeing the primary, long-term direction an asset is heading. It's a skill that separates reactive traders from strategic investors.
PinkLion’s historical data tools are built to help you cut right through this noise. Instead of getting bogged down by hourly price swings, you can zoom out to a multi-year view. This perspective immediately helps you classify the primary trend: is it bullish (a sustained uptrend), bearish (a sustained downtrend), or sideways (stuck trading in a range)?
Using Moving Averages to See Clearly
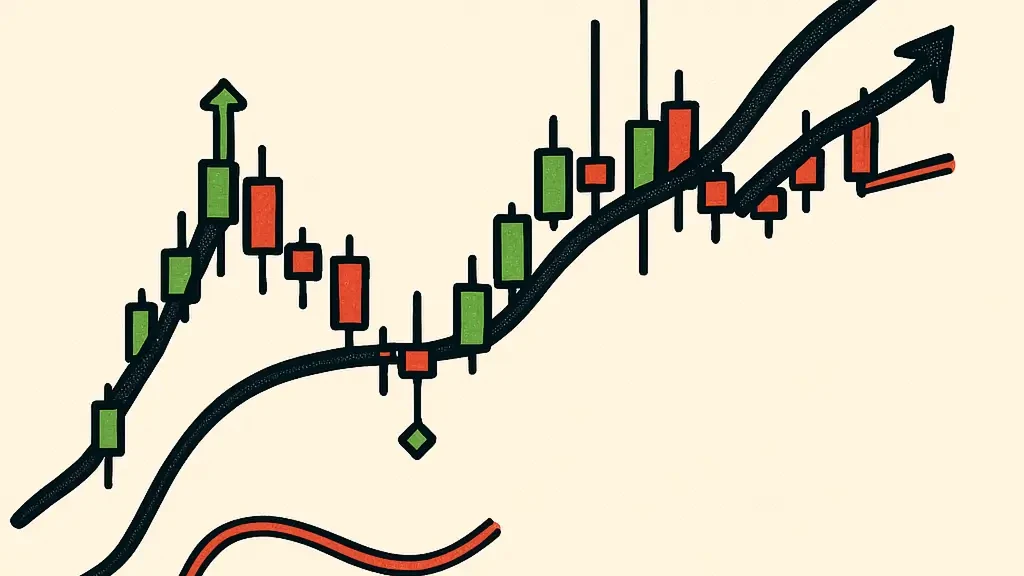
A powerful way to clarify an asset's trajectory is by applying moving averages. These indicators smooth out the price action over a set period, revealing the underlying trend much more clearly. For long-term analysis, the most common tools for the job are the 50-day and 200-day moving averages.
Think of it like this: daily price charts are the choppy surface of the sea, but a moving average is the steady tide underneath.
Inside PinkLion, you can easily overlay these indicators on any stock chart. For instance, when a stock’s price consistently stays above its 200-day moving average, it’s a strong signal of a healthy, long-term bullish trend. On the flip side, a price that stays stubbornly below that line suggests persistent bearish pressure.
A classic signal many investors watch for is the "golden cross." This happens when the shorter-term 50-day moving average crosses above the longer-term 200-day moving average. It's often seen as confirmation that a new, powerful uptrend is taking hold.
Distinguishing Trends from Fluctuations
So, how do you tell if a sudden price drop is just a temporary blip or the start of a new bearish trend? The answer is all about context and confirmation. A real, durable trend will be supported by other factors (which we'll get into later), while a temporary fluctuation often happens in isolation.
Let's walk through a real-world scenario. Imagine a big, established tech company sees its stock drop 5% in a single day because of a broader market sell-off. You pull up its chart in PinkLion and notice it’s still trading comfortably above its 200-day moving average. This context suggests the drop is likely a short-term shakeout within a much larger uptrend, not a full-blown reversal.
To make this even easier, PinkLion lets you set up automatic alerts. You can tell your dashboard to notify you the moment a stock you're watching crosses a key moving average.
This feature gives you timely signals without forcing you to stare at charts all day, letting you focus on your long-term strategy. It’s all about building a patient, data-driven perspective—the absolute foundation of successful investing.
Connecting Market Moves to Economic Indicators
Market trends never happen in a vacuum. They’re almost always a direct reaction to what’s happening in the broader economy. Getting a handle on this relationship is what separates an amateur from a pro—it’s the difference between just reading price charts and truly understanding the forces that move them.
This is where PinkLion’s Economic Analytics tools come into play. They are built to bridge that exact gap, helping you connect a stock's price swings to crucial macroeconomic data. It’s this context that gives you the "why" behind the market’s moves, letting you anticipate shifts instead of just reacting to them.
But with a constant firehose of economic news, where do you even start? The trick is to tune out the noise and zero in on the data that genuinely impacts corporate earnings and investor psychology.
Prioritizing Key Economic Data
Not all economic reports are created equal. Some hit the market with the force of a tidal wave, while others are barely a ripple. PinkLion helps you filter everything by highlighting the indicators that have historically packed the biggest punch.
These are the heavy hitters you should always have on your radar:
- Interest Rates: Central bank decisions on interest rates can flip the entire market on its head. Higher rates make borrowing more expensive for companies and can make safer assets like bonds look a lot more attractive, which usually puts downward pressure on stock prices.
- Inflation Reports (CPI): The Consumer Price Index is the market's go-to inflation gauge. When inflation runs hot, it eats away at profits and consumer spending power. That often forces central banks to hike rates, sending ripples across every sector.
- GDP Growth: Gross Domestic Product is the ultimate report card for an economy. Strong GDP growth generally means businesses are expanding and earnings are healthy—a classic bullish signal for stocks.
- Employment Figures: Strong job growth and low unemployment signal a robust economy. When more people are working and earning, they have more money to spend, which directly fuels corporate revenue.
It’s not just about the raw numbers; it’s about how they stack up against expectations. A "good" GDP report that still falls short of analyst predictions can easily send stocks tumbling. PinkLion’s tools are designed to help you catch that crucial nuance.
A Practical Scenario: Interest Rates in Action
Let's walk through a real-world example. Imagine the central bank announces it will start raising interest rates to cool down inflation. How would that signal play out across different corners of the market?
Instantly, you'd expect headwinds for technology and other high-growth stocks. These companies often rely on cheap debt to finance their aggressive expansion plans. As borrowing gets more expensive, their growth story becomes less certain, and investors often start rotating into more defensive sectors.
On the flip side, financial stocks like banks tend to thrive in a rising-rate environment because their lending margins expand.
Using PinkLion, you could set up a custom watchlist to track a major bank ETF against a popular tech ETF in the weeks following the announcement. This direct, side-by-side comparison lets you see that sector rotation happening in real-time on your screen.
PinkLion gives you direct access to this kind of powerful information, pulling data from trusted global sources. To give you a sense of the scale, top-tier platforms draw from databases covering over 20 major macroeconomic indicators for more than 200 countries. This data is sourced from local agencies and global institutions like the IMF, giving you reliable intelligence. You can learn more about the depth of global economic data that powers this kind of professional analysis.
Once you start making these connections, you'll see the market differently. It’s no longer a jumble of random price movements but a logical system reacting to tangible, real-world events. That deeper insight is what turns an average investor into a truly informed one.
Confirming Trend Strength with Volume and Liquidity

A rising stock price tells you what is happening, but it doesn't tell you the whole story. To really understand a trend's power, you have to look at trading volume—the number of shares changing hands. It’s the difference between a trend with conviction and one that's just running on fumes.
Think of it like this: a price moving up on heavy volume is like a crowd roaring in a packed stadium. A price moving on low volume is more like a single person clapping in an empty room. The first has real momentum; the second is fragile.
PinkLion’s volume visualization tools are built to show you this conviction at a glance. The old Wall Street saying, “volume precedes price,” often holds true, and our tools help you see if a trend has real market muscle or if it’s just noise.
Spotting Red Flags with Volume Divergence
One of the most powerful signals you can find is a divergence between price and volume. This happens when the price keeps moving in one direction, but volume starts heading the other way. It’s a classic red flag that often signals an impending trend reversal.
Let's walk through a scenario. A stock has been in a strong uptrend for months, hitting new highs. But when you check the volume bars in PinkLion, you notice something important: each new price peak is happening on less trading volume than the one before it.
- Price: Making higher highs.
- Volume: Making lower highs.
This is a textbook bearish divergence. It tells you that fewer and fewer people are willing to buy at these higher prices. The upward momentum is fading. Seeing this, you might decide to tighten a stop-loss or even take some profits off the table before the trend breaks down.
Using Indicators to See Institutional Footprints
To dig even deeper, PinkLion offers specialized indicators that help you spot the "smart money." These tools go beyond simple volume bars to give you a more nuanced view of buying and selling pressure.
A great example is the On-Balance Volume (OBV) indicator. It’s a running total that adds volume on up-days and subtracts it on down-days. When the OBV line is rising along with the price, it confirms a healthy, well-supported uptrend. But if the price is rising while the OBV is flat or falling, that's another divergence pointing to weakness.
Historical data consistently shows that significant market moves are backed by volume. Analysis from exchanges reveals that sharp rises in daily traded shares often precede or confirm emerging trends as more participants act decisively. You can explore over a decade of U.S. market volume data from Cboe to see this principle in action for yourself.
Understanding an asset's trading history also provides valuable context, especially around major corporate events. Things like stock splits, for instance, can dramatically impact trading volume and liquidity.
Using Forecasting and Sentiment Analysis Tools
Once you’ve dug into an asset’s history and its place in the wider economy, it's time to look forward. This is where you shift from reacting to what has happened to anticipating what could happen next. PinkLion’s AI-driven forecasting and real-time sentiment analysis tools are built for exactly this. They let you layer a predictive view on top of all your hard-earned technical and fundamental research.
Now, these tools aren't a crystal ball. Think of them more like a sophisticated GPS for the market, mapping out potential routes based on high-quality data. They add a crucial, forward-looking layer to how you analyze market trends.
Interpreting Predictive Price Corridors
PinkLion’s AI forecasting tool doesn’t just spit out a single, arbitrary price target. Instead, it generates a potential price corridor for an asset over the next year. This is a projected range complete with optimistic and pessimistic boundaries—where the price is statistically likely to trade based on historical volatility, expert estimates, and current market conditions.
This corridor approach is far more practical than a single number. It helps you visualize a whole spectrum of likely scenarios, which makes your strategy planning much more flexible.
For instance, you might see a stock’s price projected to trade between $150 and $185 over the next 12 months. That single insight helps you set realistic profit targets and define potential entry or exit points, all while keeping the upside and downside risk clearly in view.
Gauging the Market's Mood with Sentiment Analysis
Charts and financial statements tell one part of the story, but let's be honest: markets are driven by human emotion. That’s why understanding the collective mood, or sentiment, is so critical. PinkLion’s sentiment analysis tool acts like a digital ear to the ground, scanning millions of data points from news articles, social media chatter, and financial reports in real-time.
It then distills all that noise into a simple, actionable score. Is the conversation around an asset overwhelmingly positive, negative, or just neutral?
A sudden, measurable shift in sentiment can be a powerful leading indicator. I've seen stocks get hammered by negative news, only for their sentiment score to start ticking up well before the price chart shows any sign of a bottom. It's often the first clue that the worst is over and perceptions are starting to shift.
Imagine you've found a stock in a clear technical downtrend. You pull up its sentiment score in PinkLion and see it’s been deeply negative for weeks. Then, you notice the score begins to crawl from negative toward neutral, and finally into positive territory, even while the price is still bumping along the bottom.
This change in mood, combined with the technical and economic signals you’ve already gathered, can serve as powerful confirmation for your investment thesis. It suggests the narrative is changing, potentially ahead of a price recovery. If you want to go deeper, exploring resources on how to use market sentiment analysis for trading can provide even more actionable insights.
By weaving together predictive models with real-time sentiment, you round out your analysis, creating a robust, multi-layered view of any asset.
Putting It All Together: A Hands-On Analysis with PinkLion
Theory is a good starting point, but the real skill comes from getting your hands dirty. Let's walk through a complete analysis from start to finish, showing you exactly how to apply these concepts on the PinkLion platform.
This isn't just a generic example. We'll use a real-world company, Advanced Micro Devices (AMD), to show you how a professional-grade analysis comes together. I'll take you through the repeatable workflow I use: start with the big picture trend, layer in the economic story, confirm strength with volume, and finish with a forward-looking forecast.
Setting the Stage with AMD
First things first, pull up AMD on the PinkLion dashboard. Before getting lost in the daily noise, we need to understand the stock's long-term personality. A quick glance at a multi-year chart with the 200-day moving average applied immediately tells us the primary trend. Is it in a long-term uptrend, downtrend, or just chopping sideways? This gives us the frame for everything that follows.
Next, we ask: is AMD moving on its own, or is the whole market carrying it? We can cross-reference its chart with key data points from PinkLion's Economic Calendar. I’m looking for things like recent CPI reports or semiconductor industry sales figures. This helps me figure out if the trend is driven by company-specific news or just broader market momentum.
This screenshot shows how you can combine technicals like moving averages with volume on a single screen right inside PinkLion.
You can see how the price interacts with those key moving averages, while the volume bars below tell you when the big money was either buying or selling with conviction.
Validating and Forecasting the Trend
Once we've identified the main trend, we need to know if it's for real. This is where I bring in PinkLion's On-Balance Volume (OBV) indicator. A rising OBV alongside a rising price is a great sign—it suggests institutions are accumulating shares and the move has support. A divergence, where price rises but OBV flattens or falls, is a major red flag. This step is absolutely critical for sidestepping weak or fake-out moves.
Pro Tip: Big corporate events can totally change how a stock trades. To really understand AMD's chart, you have to look at its history. For deeper context, you can explore the AMD stock split history to see how those events impacted its price action and liquidity.
Finally, it’s time to look ahead. I'll activate PinkLion’s AI Asset Forecast to get a potential one-year price corridor for AMD. This isn't a crystal ball, but it gives me a statistically-backed range of what could happen. I'll pair this with a look at the Sentiment Analysis tool. If I see sentiment shifting from neutral to positive, and all my other analysis lines up, I'm building a very comprehensive picture.
By following this process, you’re not just looking at a price chart. You're building a multi-layered case for an investment. You methodically move from the big picture to the small details, combining historical price, economic context, volume confirmation, and predictive insights. That’s how you turn abstract knowledge into confident, actionable decisions.
Common Questions About Analyzing Market Trends
Even with a solid process, a few questions always seem to pop up when you're getting your hands dirty with trend analysis. It’s just part of the journey. Let’s tackle some of the most common ones we hear from investors to help clear up any confusion and sharpen your approach.
How Often Should I Re-Analyze a Trend?
There’s no magic number here—it all comes down to your investment horizon.
If you’re a long-term investor looking to hold assets for years, a deep-dive review every quarter is probably sufficient. This gives you enough time to gauge how your thesis is playing out against major economic shifts without getting spooked by daily market chatter.
But if you're a swing trader holding positions for just weeks or months, you need to be much more active. A weekly review is a good baseline. You have to stay plugged into the shorter-term momentum and sentiment shifts that could signal an early entry or, more importantly, a quick exit.
The key is to match your analysis frequency to your strategy. A mismatch is a classic mistake. I’ve seen long-term investors get shaken out by short-term noise and swing traders miss the forest for the trees.
What Is a False Breakout and How Do I Avoid It?
A false breakout is a trader’s worst nightmare. It’s when a stock’s price punches through a key resistance level, looking like it’s about to start a new uptrend, only to lose steam and fall right back below it. It's a textbook trap that can chew up your capital.
Your best defense is confirmation. Never, ever act on price movement alone. I always tell people to wait for at least two of the following signals in PinkLion before trusting a breakout:
- High Volume: A real breakout should be powered by a significant spike in trading volume. If volume is low, it suggests there's no real conviction behind the move. It's weak.
- Supportive Indicators: Check your other tools. Is the RSI confirming the strength? Is the MACD showing bullish momentum? The more indicators that agree, the better.
- Follow-Through: This one requires patience, but it pays off. Wait for the next one or two daily candles to close above the breakout level. A quick pop and drop isn't a trend; it's just noise.
Can I Analyze Trends for Stocks with Limited History?
Analyzing newer stocks, like recent IPOs, is definitely tricky. You simply don't have enough historical data to lean on traditional long-term indicators like the 200-day moving average. So, you have to shift your focus.
Instead, you should prioritize things like volume analysis, sentiment scores, and the stock’s relative strength compared to its industry ETF. You can also look at how similar companies reacted to major corporate actions in the past. For a great example of this, check out our guide on the AMZN stock split history to see how big events can shape a stock's trajectory—a useful lesson even when you're looking at newer listings.
Ready to stop guessing and start making data-driven decisions? PinkLion gives you the professional-grade tools to analyze trends, test your strategy, and build a stronger portfolio. Start for free and take control of your investments today.