How to Backtest Trading Strategies: A Pro's Guide
Learn how to backtest trading strategies effectively. Discover expert tips on how to backtest trading strategies and improve your trading success.

Backtesting is the process of simulating a trading idea on historical market data to see how it would have performed. It's the single most important, data-driven step you can take to validate a strategy before putting a single dollar at risk in live markets.
What Is Backtesting and Why It Matters
Let’s say you have a promising new trading strategy. Your gut tells you it’s a winner, and the logic feels sound. But in trading, gut feelings and good logic can lead you straight off a financial cliff. Backtesting is your personal trading laboratory—a risk-free sandbox where you can stress-test that idea against the brutal reality of past market moves.
You're essentially rewinding the clock to see how your specific rules would have navigated historical bull runs, brutal bear markets, and everything in between. This is what separates a systematic, evidence-based approach from one built on pure hope.
From Guesswork to a Systematic Approach
Without backtesting, you’re flying blind. You have no real idea if your strategy has a true edge or if a few early wins were just dumb luck. A solid backtest gives you the statistical confidence to stick to your plan, especially during the inevitable losing streaks that shake out unprepared traders.
But it’s about more than just a "yes" or "no" on profitability. A good backtest helps you understand your strategy's unique personality. It answers critical questions like:
- What’s the win/loss ratio?
- How big are the average winning trades compared to the losers?
- What’s the longest losing streak I should mentally prepare for?
- How much of my capital could I have lost during the worst period (maximum drawdown)?
Answering these questions is how you manage risk effectively and set expectations that are grounded in reality, not fantasy.
Before diving into the process, it's helpful to understand the key ingredients. Every solid backtest, whether done manually in a spreadsheet or with a sophisticated tool, relies on the same core components.
Here’s a quick rundown of what you need to have in place:
Core Components of a Trading Strategy Backtest
Having these four elements clearly defined turns a vague idea into a testable hypothesis. It's the foundation of disciplined, quantitative trading.
The real magic of backtesting is that it forces you to define every single rule of your strategy with absolute, painful precision. Ambiguity is the enemy of consistent results, and a backtest demands total clarity on entries, exits, position sizing, and risk.
An Established Practice in Finance
Backtesting isn’t some new-age trick; it’s a cornerstone of professional trading that has evolved dramatically over the decades. Its roots are planted firmly in the rise of quantitative trading, which really took off in the 1980s and 1990s as computing power exploded. As algorithmic trading grew, so did the practice of rigorously testing strategies against massive datasets—sometimes analyzing millions of historical trades just to find a tiny statistical edge. You can learn more about the history of backtesting and see how it became central to modern finance.
Ultimately, backtesting is your first and best line of defense against flawed strategies. It helps you kill bad ideas quickly and cheaply. That’s why platforms like PinkLion integrate this powerful capability, simplifying what was once a complex, code-heavy process. With our backtesting tool, you can go from a rough idea to a refined, stress-tested strategy with the confidence that your decisions are backed by data, not just a hunch.
Sourcing and Preparing High-Quality Data

Let's get one thing straight: a brilliant trading strategy is completely worthless if you test it on junk data. Think of historical market data as the fuel for your backtesting engine. If you pour in low-grade fuel, you're going to get stalls, misfires, and eventually, a total breakdown.
The reliability of your simulation is a direct reflection of the data you feed it. This makes the data preparation phase the most critical step in this whole process. Getting it wrong can make a losing strategy look like a goldmine or, worse, hide the massive risks in what seems like a winner. It's a common stumbling block, but a little methodical work here ensures you’re building on solid ground.
Choosing the Right Data Granularity
First up, you need to decide on the right data frequency, or granularity. This choice depends entirely on your strategy's timeframe. Get this wrong, and you might as well not even run the test.
End-of-Day (EOD) Data: Perfect for long-term strategies like swing or position trading, where your decisions hinge on daily closing prices. It’s cleaner and has less noise, but it's totally useless for any strategy that trades more than once a day.
Intraday Data (1-minute, 5-minute, etc.): This is non-negotiable for day trading. It gives you a detailed look at price action during the day, letting you test ideas based on specific intraday patterns. If your strategy tries to catch a 30-minute trend, you need at least 1-minute data to simulate it properly.
Tick Data: The most granular data possible, recording every single trade and price quote. This is really only necessary for high-frequency trading (HFT), where bid-ask spreads and execution speed are everything. For most of us, it’s computational overkill.
Trying to backtest an intraday scalping strategy with daily data is like trying to navigate a city with a world map—the details you need just aren't there. This is where platforms like PinkLion make life easier by providing access to 30 years of asset history, ensuring you have the right data granularity for any strategy you can dream up.
The Reality of Data Cleaning
Finding data is only half the job. Prepping it is where the real work—and the real value—comes in. Raw historical data is almost never perfect. It's often riddled with errors and needs careful cleaning to reflect what actually happened in the market.
A backtest is a mirror reflecting the data it's given. If the data is dirty, with gaps, errors, or biases, the reflection will be a distorted and dangerously misleading image of your strategy's true potential.
You absolutely have to tackle these common data problems:
Missing Data (Gaps): Feeds drop out. Exchanges have issues. You'll find gaps. You have to decide how to handle them, whether that means filling them in with a method like forward-fill or just excluding that period from your test entirely.
Corporate Actions: Stock splits, dividends, and mergers fundamentally change a stock's price. Your data must be adjusted for these events. A non-adjusted chart will show a cliff-like price drop after a 2-for-1 split, which would incorrectly trigger every stop-loss in your simulation and render the results useless.
Survivorship Bias: This is a subtle but deadly flaw. It happens when your data only includes companies that are still around today, conveniently forgetting all the ones that went bankrupt or got acquired. A backtest on this kind of data will look way too optimistic because it has systematically excluded all the losers. For a truly robust test, you need data that includes delisted stocks.
The process of manually adjusting for splits and dividends is tedious, but it's completely non-negotiable for an accurate backtest. This is another area where a dedicated tool shines. Platforms often handle these adjustments automatically, saving you from a major source of error and letting you focus on what really matters: how to backtest trading strategies effectively.
Translating Your Strategy Into Testable Rules
This is where the rubber meets the road. An idea like "buy low, sell high" is a wish, not a strategy. To run a backtest that means anything, you have to turn that vague concept into a rigid, mechanical set of rules a computer can follow without any wiggle room.
The whole point is to wring out every drop of human subjectivity, discretion, and emotion. If you can't define your strategy with absolute, non-negotiable precision, your backtest results will be garbage. Every single action—from entry to exit—needs a concrete trigger.
Defining Your Core Strategy Rules
Let’s take a classic example that almost everyone tries at some point: a moving average crossover strategy. The basic idea is simple: buy when a short-term moving average crosses above a long-term one, signaling a potential new uptrend.
But "buy on a crossover" is still way too fuzzy. We need to hammer this down into an unbreakable rulebook.
Entry Signal: What exactly triggers an entry? Is it when the 50-day simple moving average (SMA) closes above the 200-day SMA? Or does it just have to touch it during the day? You have to be specific: "Enter a long position at the opening price of the next trading day after a daily close where the 50-day SMA is greater than the 200-day SMA."
Exit Signal (For Profit): When do you cash out? A fixed percentage target? A trailing stop? A reverse signal? Let's lock one in: "Exit the position when the 50-day SMA crosses back below the 200-day SMA."
Exit Signal (For a Loss): You absolutely must have a predefined stop-loss. This is non-negotiable for risk management. A clear rule could be: "Exit the position immediately if the price drops 10% below the entry price."
Position Sizing: How much capital will you put on the line for each trade? A common approach is to risk a fixed percentage of your total portfolio, say 2%. This rule determines how many shares you buy based on your stop-loss distance.
These four pieces—entry, profit exit, stop-loss exit, and position sizing—are the mechanical heart of your system. There is no room for "I think" or "it feels like."
The real value of this rule-making process isn't just for the backtest. It forces a level of discipline and clarity that's crucial for live trading, stopping you from making emotional calls when real money is on the line.
Choosing Your Backtesting Tools
Once your rules are crystal clear, you need a tool to apply them to historical data. Your choice really boils down to your technical skill and how complex your strategy is.
1. Spreadsheets (e.g., Excel, Google Sheets)For very simple, end-of-day strategies, a spreadsheet can get the job done. You can download historical price data, create columns for your indicators (like SMAs), and use formulas to flag your entry and exit signals.
- Pros: Everyone has access to it, no coding needed, and it’s a good way to learn the basic mechanics.
- Cons: It's incredibly time-consuming, ridiculously easy to make a mistake, and completely impractical for anything but the simplest strategies.
2. Backtesting PlatformsFor most traders, this is the most practical path. Platforms like PinkLion build backtesting right into their system, providing the data and the engine to run the simulation. You define your rules using a friendly interface, and the platform handles all the heavy lifting. It's the most efficient way to learn how to backtest trading strategies without getting bogged down in technical hell.
3. Programming Languages (e.g., Python)For ultimate flexibility and control, you can code your backtester from scratch. Using a language like Python with libraries such as Backtrader or Pandas lets you build highly complex, custom strategies. This is the route quantitative hedge funds take, but be warned: it's a very steep learning curve.
Here’s how these options stack up for our moving average example:
For the vast majority of investors, a dedicated platform like PinkLion offers the perfect balance of power and ease of use. It lets you focus on refining your strategy's logic instead of wrestling with data management and coding errors. Your rules can be entered, tested, and tweaked in a fraction of the time, making the entire process far more productive.
Running the Test and Making Sense of the Results
You’ve done the hard prep work. You sourced clean data and hammered your trading idea into a strict set of mechanical rules. Now for the moment of truth: running the simulation and figuring out what the mountain of data it spits out actually means.
This is where you graduate from a simple "did it win or lose?" verdict to truly understanding your strategy's personality.
The first number most traders jump to is net profit, but looking at that alone is a classic rookie mistake. A profitable backtest can easily hide fatal flaws, like taking on catastrophic risk to make those gains. To really know how to backtest trading strategies, you have to dig deeper into the performance metrics that tell the whole story.
Think of it like a doctor reviewing a patient's full blood panel, not just taking their temperature. Each metric is a vital sign, revealing the health, risk, and consistency of your strategy.
Beyond Net Profit: The Key Performance Metrics
A solid backtest report will throw a dashboard of stats at you. It can feel overwhelming at first, but honestly, you can get 80% of the insights you need by mastering just a handful of key indicators. Let’s break down the ones that matter most.
Maximum Drawdown (Max DD): This is arguably the most important risk metric of them all. It measures the biggest drop your account took from a peak to a subsequent low. It answers the gut-check question: "What's the most pain I would have had to stomach to stick with this strategy?" A strategy with a 60% return sounds great until you see it came with a 50% max drawdown. Almost no one can psychologically handle that kind of swing.
Sharpe Ratio: This is your risk-adjusted return. In simple terms, it tells you how much return you earned for each unit of risk (volatility) you took on. A Sharpe ratio above 1.0 is generally considered good—it signals you’re being compensated fairly for the risks you're taking.
Profit Factor: This one's simple and powerful: gross profit divided by gross loss. A profit factor of 2.0 means you made twice as much on your winning trades as you lost on your losing ones. Anything below 1.0 is a losing strategy, while a number north of 1.5 starts to look pretty interesting.
Win Rate and Average Win/Loss: A high win rate feels great, but it’s a vanity metric on its own. A strategy could win 90% of the time, then have one catastrophic loss that wipes out all those tiny gains. You have to look at it alongside your average win and average loss to see the real risk-reward dynamic.
Looking at these metrics together is what separates amateurs from pros. A good backtest isn't just about applying rules to historical data; it's about seeing if the results are robust enough to trust. For instance, a strategy showing a 12% average annual return with a max drawdown of only 10% and a Sharpe ratio over 1.0 is starting to look solid. Most experts also recommend you have at least 100 to 200 trades in your backtest to have any statistical confidence. You can discover more insights on using historical data properly on afterpullback.com.
Interpreting Key Backtesting Performance Metrics
So, how do you quickly tell a good result from a bad one? A simple comparison can make it crystal clear. Here’s a table showing what a viable strategy might look like next to a deeply flawed one.
This table instantly shows why you can't just look at net profit or win rate. The "Failed Strategy" won 80% of the time but was ultimately a money-loser with terrifying drawdowns. The "Viable Strategy" looks much more stable and tradeable.
Visualizing Your Backtest Results
Numbers on a page are abstract. What really brings a strategy’s performance to life is seeing it charted out. A quality backtesting platform like PinkLion automatically generates these visuals, making the story behind the numbers much easier to grasp.
Take a look at the chart below. It compares two hypothetical strategies and makes the winner obvious in seconds.
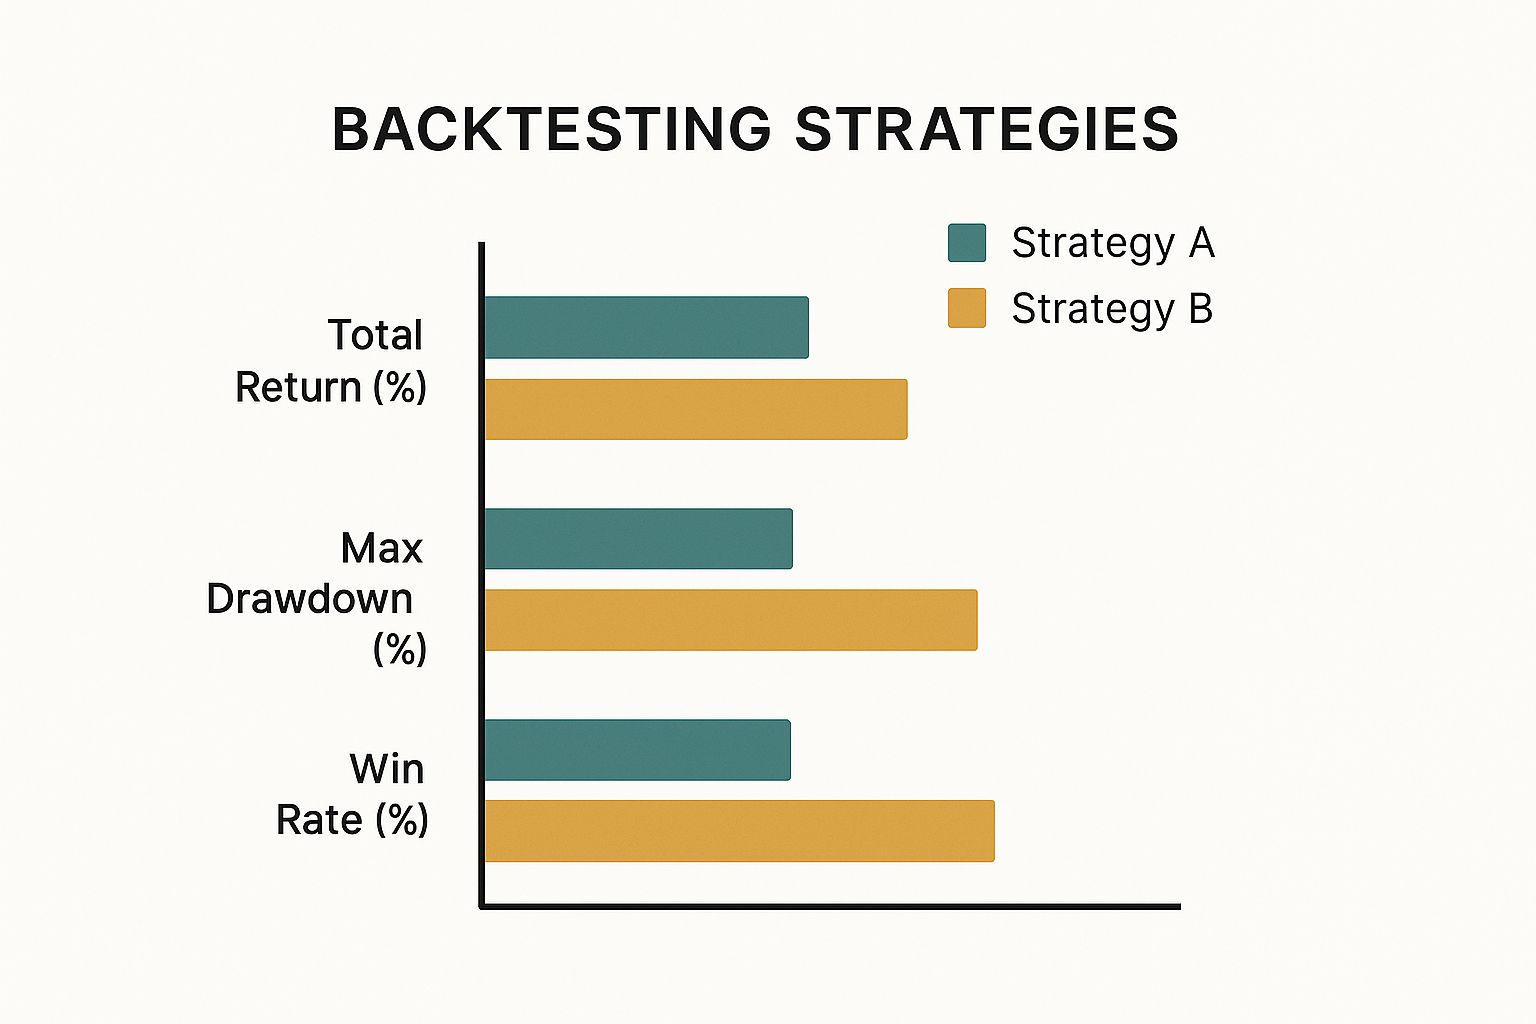
You can see immediately that while Strategy A has a higher win rate, Strategy B delivered a better total return with a much smaller maximum drawdown. That points to a far better risk-reward profile.
Key Takeaway: The single most important chart is the equity curve—a graph of your portfolio's value over time. Think of it as your strategy’s biography. A smooth, steadily rising curve is the dream. A volatile, jagged curve, even if it ends higher, signals a stressful, high-risk journey you probably don't want to take with real money.
By running the simulation and then diving deep into these core metrics and visuals, you turn raw data into actionable intelligence. You’ll finally know if your strategy was profitable in the past, but more importantly, you’ll understand its risk profile, its consistency, and whether you could actually trade it when real money is on the line.
How to Avoid Common Backtesting Pitfalls
An impressive backtest report can be dangerously misleading if the simulation was flawed. This section is all about the common traps that invalidate results, creating a false sense of security that can lead traders to risk real capital on a strategy that was never actually viable.
We'll dig into the subtle but critical mistakes that can dramatically skew your results. By understanding these pitfalls, you can build robust tests that stand up to scrutiny and give you a true picture of your strategy's potential.
The Danger of Curve-Fitting
One of the most seductive traps in backtesting is curve-fitting, sometimes called over-optimization. This is what happens when you endlessly tweak your strategy’s parameters until it perfectly matches the historical data you’re testing on—including all its random noise and one-off quirks.
The result is a strategy that looks absolutely phenomenal on paper. The equity curve soars, the win rate is stellar, and the drawdown seems nonexistent. The problem? You haven't discovered a true market edge; you've just built a system that's perfectly tailored to the past. When you take it to a live market, it almost always falls apart because the unique noise it was fitted to no longer exists.
Think of it like creating a key. If you file it down to fit one very specific, quirky lock (your historical data), it'll work perfectly on that single lock. But it will fail to open any other lock (the live market) because it's too specialized.
A backtest that looks too good to be true probably is. Extreme performance is often a red flag for curve-fitting, where a strategy has been optimized to historical noise rather than a repeatable market edge.
So, how do you fight this? The best defense is to treat your historical data like a precious, limited resource.
Out-of-Sample (OOS) Testing: This is the gold standard. You divide your historical data into two separate periods. Build and optimize your strategy on the first period (the in-sample data). Then, without making any more changes, you test its performance on the second period (the out-of-sample data) that the model has never seen before.
Walk-Forward Analysis: This is an even more advanced method. It involves optimizing a strategy on one segment of historical data, then testing it on the next segment. You repeat this process in rolling windows across your entire dataset, giving you a much more realistic simulation of how a strategy would be re-optimized and traded over time.
Platforms like PinkLion make this much easier by providing the tools and extensive data history needed to perform these validation techniques, helping you build strategies that are robust, not just lucky.
The Three Biases That Invalidate Results
Beyond curve-fitting, several sneaky biases can creep into your backtest, making a losing strategy appear profitable. You have to be vigilant in hunting down and eliminating them.
1. Survivorship BiasThis is a classic error. It happens when your dataset only includes assets that are still actively trading today, conveniently forgetting all the companies that went bankrupt, were delisted, or merged out of existence. A backtest on this skewed data will always look overly optimistic because it has systematically excluded all the losers. For an accurate test on stocks, you need a point-in-time dataset that includes these delisted symbols.
2. Look-Ahead BiasThis error occurs when your simulation uses information that wouldn't have been available at the time of the trade. For instance, using the closing price of a candle to decide to enter a trade during that same candle is a form of look-ahead bias, since you wouldn't know the close until the candle was finished. Another example is using financial data that was reported on one date but only became publicly available later.
3. Ignoring Transaction CostsThis is a simple but costly mistake. Every trade you make in the real world incurs costs—commissions, slippage, and spreads. Slippage is the difference between the price you expected and the price you actually got. While these costs seem small on a single trade, they add up significantly over hundreds or thousands of trades and can easily turn a profitable strategy into a losing one.
Here’s a quick breakdown of how these biases can poison your results:
Learning how to backtest trading strategies properly means becoming a detective, constantly searching for and stamping out these hidden flaws. A clean, bias-free test might not produce a jaw-dropping equity curve, but it will give you something far more valuable: the truth about your strategy's edge.
Frequently Asked Questions About Backtesting
Once you start moving from theory to practice, the real questions pop up. It's one thing to read about backtesting, but it's another thing entirely to get your hands dirty and run one yourself. This is where we tackle those common "what if" and "how do I" moments that every trader faces. Think of this as your field guide to building more reliable and insightful tests.
How Much Historical Data Is Enough for a Reliable Backtest?
There's no magic number here. The right amount of data depends entirely on how often your strategy trades. A scalping strategy firing off trades every few minutes needs a completely different dataset than a long-term position strategy that might only act a few times a year.
The real goal is to capture enough trades and market conditions to get a statistically significant result.
For day trading strategies: You'll want at least a few years of high-frequency data, like 1-minute or 5-minute bars. This is the only way to simulate thousands of trades and see how your logic holds up across different intraday patterns and volatility spikes.
For swing or position trading: A much longer time horizon is non-negotiable. I'd aim for at least 10-20 years of daily data. This ensures your strategy is stress-tested against full market cycles—bull runs, brutal bear markets, sideways grinds, and black swan events.
A solid rule of thumb is to aim for a backtest that generates a bare minimum of 100-200 trades. Anything less, and your sample size is probably too small to trust. If your strategy is a low-frequency one, you'll need to use a much longer historical period to hit that threshold.
What Is the Difference Between Backtesting and Forward Testing?
Think of it as lab research versus a clinical trial. Both are crucial for validating a new idea, but they serve very different purposes.
Backtesting is your lab work. It’s a pure simulation where you apply a rigid set of rules to historical data. This is where you find out if your idea has a theoretical edge in a controlled environment. It’s fast, letting you churn through dozens of concepts without risking a dime.
Forward testing, or paper trading, is the clinical trial. You take your validated strategy and trade it in the live market, in real-time, but with pretend money. This is the critical bridge between simulation and reality. It’s where you uncover all the real-world frictions that backtests struggle to model perfectly, such as:
- Slippage: The nasty gap between the price you wanted and the price you actually got.
- Order Fills: Will your limit orders get filled in a fast-moving market, or will you be left chasing the price?
- Emotional Pressure: How do you really behave when you see a trade going against you in real-time?
A strategy isn’t truly battle-tested until it has passed both.
Does a Profitable Backtest Guarantee Future Success?
Absolutely not. If you take one thing away from this, let it be this: a great backtest is a prerequisite, not a promise.
Markets are dynamic, living systems, not static historical records. Past performance will never be an ironclad guarantee of future results. A robust backtest simply increases your odds of success by proving your strategy has a verifiable statistical edge. It elevates your trading from guesswork to a data-driven discipline.
But unexpected events—so-called "black swans"—or fundamental shifts in market behavior can, and will, cause even the most stellar historical strategy to fail. That’s why a clean backtest is just the starting line. The real work continues with diligent forward testing and constant performance monitoring once you go live.
How Do I Know If I Am Curve-Fitting My Strategy?
Curve-fitting, or over-optimization, is the dark art of tweaking your strategy’s parameters until they perfectly match the random noise in your historical data. It produces a backtest that looks like a holy grail, but the strategy almost always implodes the moment it hits a live market.
The single most powerful defense against this is out-of-sample (OOS) testing. This is a cornerstone technique used by every serious quant trader.
- Divide Your Data: Split your entire historical dataset into two separate, non-overlapping periods. The first, larger part (say, 70-80% of the data) is your in-sample set. The rest is your out-of-sample set.
- Develop and Optimize: Build and fine-tune your strategy using only the in-sample data. Don't let it see a single tick of the out-of-sample data.
- Validate: Once you’ve locked in your final parameters, run the unchanged strategy on the out-of-sample data. This is its first encounter with this period.
If performance falls off a cliff in the out-of-sample period, you've almost certainly curve-fit your model. A robust strategy will show reasonably consistent results across both datasets. This is how you build real confidence that you’ve found a genuine edge, not just a historical fluke.
Ready to move from theory to practice with a platform that handles the heavy lifting? PinkLion provides all the tools you need—including 30 years of asset history and an intuitive backtesting engine—to test your strategies the right way. Start for free at PinkLion and begin building data-driven confidence in your trading ideas today.