How to Evaluate Investment Opportunities: A Expert Guide
Learn how to evaluate investment opportunities effectively. Our guide covers key metrics, risk analysis, and insights to help you make smart investment decisions.


The short answer? You evaluate investment opportunities by blending the hard numbers (quantitative analysis), the business story (qualitative analysis), and a clear-eyed look at the risks—all tailored to your own goals. This three-part approach is what separates smart, deliberate investing from just chasing trends.
Building Your Investment Evaluation Framework

Before you dive into analyzing a single stock, you need a personal blueprint for how you'll make decisions. Seriously, don't skip this. Without a framework, you're flying blind, leaving yourself wide open to emotional choices driven by market hype or gut-wrenching fear.
Think of it as setting the rules of the game before you play. This framework becomes your North Star, ensuring every potential investment gets measured against the same logical standard. It's how you build the confidence to assess any opportunity, knowing each choice fits into your larger financial picture. While your framework will be personal, it helps to understand the universal principles that underpin a solid investment decision-making process.
Here are the core components you need to build out.
Core Components of Investment Evaluation
Each of these pillars works together, giving you a comprehensive view that goes far beyond a stock's ticker symbol. Now, let's break down how to build the personal side of this framework.
Define Your Financial Goals and Timeline
First things first: what are you investing for, and when do you need the cash? Are you saving for a down payment on a house in five years? Or are you building a nest egg for a retirement that’s three decades away? The answer completely changes the kind of risk you can afford to take.
Your goals need to be specific. "Grow my wealth" is too vague. Try something concrete, like "achieve a $1.5 million portfolio by age 60." This clarity tells you the rate of return you need and helps shape your entire strategy.
A longer timeline means you can generally be more aggressive because you have more time to ride out market downturns. A shorter timeline, on the other hand, demands a more conservative approach where protecting your capital is the top priority.
Key Takeaway: Your personal goals and timeline are the ultimate filter. An opportunity is only "good" if it fits your life and moves you closer to your objectives.
Assess Your Personal Risk Tolerance
Next, you have to be brutally honest with yourself about your comfort level with market swings. This isn't just a feeling; you can ground it in data. Since 1957, the S&P 500 has delivered an average annual return of roughly 8.00%, but that smooth average hides wild rides with major gains and painful losses.
So, what would you really do if your portfolio plummeted by 20% in a couple of months? Would you panic and sell everything? Or would you see it as a chance to buy more at a discount? Answering that question honestly is critical for building a portfolio you can actually stick with when the market gets rocky.
This is where tools like PinkLion’s scenario simulations come in handy. You can visualize potential drawdowns and see how different asset mixes might behave under stress. It also helps you spot red flags early, like a stock with a history of extreme volatility or sharp declines. If you see something concerning, you can dig deeper by looking into its past corporate actions, like a company's stock split history, to understand what drove that behavior.
Decoding the Numbers with Key Financial Metrics

Diving into a company's financial statements can feel like you’re trying to read another language. But this is where the real story of a company’s health is told. We're moving beyond splashy headlines and surface-level numbers like revenue to focus on the quantitative metrics that truly drive long-term value.
Think of these metrics as a doctor checking vital signs. A single number won't tell you everything, but together, they paint a clear picture of a company's health, its risks, and its potential. They also give us a standardized way to compare different companies, even if they operate in completely different industries.
Reading Market Sentiment with the P/E Ratio
The Price-to-Earnings (P/E) ratio is one of the first metrics most investors learn, and for good reason. It’s a quick gut check on market sentiment. In simple terms, it tells you how much investors are willing to pay for every dollar of a company's profit. You find it by dividing the current stock price by its earnings per share (EPS).
A high P/E, like 40x, suggests the market has sky-high expectations for future growth. On the flip side, a low P/E of 8x might point to a mature, slower-growing company—or it could be a hidden gem the market is completely overlooking. The key is context. Always compare a company's P/E to its direct competitors and its own historical average.
A common mistake is treating the P/E ratio as a simple "good" or "bad" indicator. It’s a measure of expectation. A high P/E isn't inherently bad if the company can deliver the growth to justify it.
Gauging Financial Stability with Debt-to-Equity
Next up, you have to play defense and look at risk. The Debt-to-Equity (D/E) ratio is your go-to metric for this. It directly compares a company’s total debt to its shareholder equity, showing you exactly how much leverage it's using to run the business.
A D/E ratio below 1.0 is generally a good sign, showing that the company relies more on its own capital than debt. But when you see a ratio climbing past 2.0, it can be a red flag. High leverage can supercharge returns in good times but becomes a massive anchor during economic downturns when that debt still needs to be paid.
When looking at the D/E ratio, ask yourself:
- Is the ratio low and stable? This points to a conservative and sturdy financial structure.
- Is it high or rising quickly? This isn’t automatically a deal-breaker, but it demands a closer look. Is the debt being used to fund smart, profitable growth, or is it a sign of a company struggling to stay afloat?
Measuring Profitability and Efficiency with ROE
Finally, let's talk about efficiency. How good is the management team at turning shareholders' money into actual profit? The answer is in the Return on Equity (ROE). This metric calculates a company's net income as a simple percentage of its shareholder equity.
A consistently high ROE, especially one above 15%, is a fantastic sign. It tells you management is skilled at deploying capital effectively. But there's a catch. You have to look at ROE alongside the D/E ratio. A company can easily juice its ROE by piling on a mountain of debt. Seeing a high ROE and a reasonable D/E ratio is how you confirm genuine, efficient profitability.
Getting comfortable with these metrics is the foundation of smart investing. While each one tells a part of the story, combining them gives you a powerful, data-driven perspective.
Looking Beyond the Balance Sheet
The best investments are rarely found in spreadsheets alone. While financial metrics give you a clean snapshot of a company’s past performance, its future is often written in the things you can’t easily quantify.
This is where qualitative analysis—the art of understanding the business itself—comes into play. It’s about digging deeper to figure out a company's staying power. What makes this business special? Can it defend its profits from competitors for years, or even decades? Answering these questions separates the good companies from the truly great investments.
Uncovering the Economic Moat
Legendary investor Warren Buffett famously coined the term economic moat to describe a company's sustainable competitive advantage. Think of it as an invisible fortress protecting a business from rivals, allowing it to maintain profitability over the long haul. A wide moat is one of the most powerful signs of a quality business you can find.
These moats come in a few key forms:
- Brand Power: Think of how brands like Nike or Apple command premium prices and fierce customer loyalty. This isn't just marketing fluff; it's a powerful asset that makes it incredibly difficult for competitors to steal market share. Strong brand equity translates directly into pricing power and stable demand.
- Proprietary Technology or Patents: A company might own critical technology or a patent that others simply cannot replicate, giving it a legal monopoly for a set period. This is a common sight in the pharmaceutical and tech sectors.
- Network Effects: This happens when a product or service becomes more valuable as more people use it. Social media platforms like Meta or marketplaces like eBay are classic examples. Each new user makes the platform better for all the others, creating a powerful, self-reinforcing advantage.
- Switching Costs: Sometimes, it’s just too expensive, time-consuming, or inconvenient for a customer to switch to a competitor. Think about your company's core software system or even your personal bank; the hassle of moving everything is a powerful deterrent.
Key Takeaway: A business without a moat is just a commodity, forced to compete on price. But a business with a wide, durable moat can compound value for shareholders for decades.
Evaluating the Leadership Team
A company is only as good as the people running it. That’s why you have to evaluate the leadership team—a critical, yet often overlooked, part of the process. You're not just buying a stock ticker; you're entrusting your capital to a management team to make smart decisions on your behalf.
Look for leaders who are not just experienced but also transparent and aligned with shareholders. Do they have a clear, compelling vision for the future? Do they own a significant amount of company stock, ensuring their interests are the same as yours? You can get a feel for this by reading annual reports, listening to earnings calls, and seeing how they handle tough questions.
Their big strategic moves, like a stock split, can also reveal a lot. To get a better sense of their track record, you can explore a company's stock split history to see how past actions were explained and what they signaled to the market.
A Practical Guide to Risk and Market Cycles
Risk is the price of admission to the market. But learning how to understand and manage it is what separates a rookie from a seasoned investor. A smart evaluation isn't just about a company's balance sheet; it's about seeing the bigger picture of risk and market dynamics.
After all, a great company can still lose you money if it gets caught in a downdraft that has nothing to do with its own operations.
First, let's get one thing straight: not all risk is the same. It’s helpful to think of it in two main buckets:
- Systematic Risk: This is the big stuff. Think major economic recessions, shifts in interest rates, or geopolitical shocks. It affects almost everything in the market, and you can't diversify it away completely. But you can prepare for it.
- Unsystematic Risk: This is the company-specific stuff. A disastrous product launch, a new competitor stealing market share, or a key executive jumping ship. This is the kind of risk you can manage effectively through smart diversification.
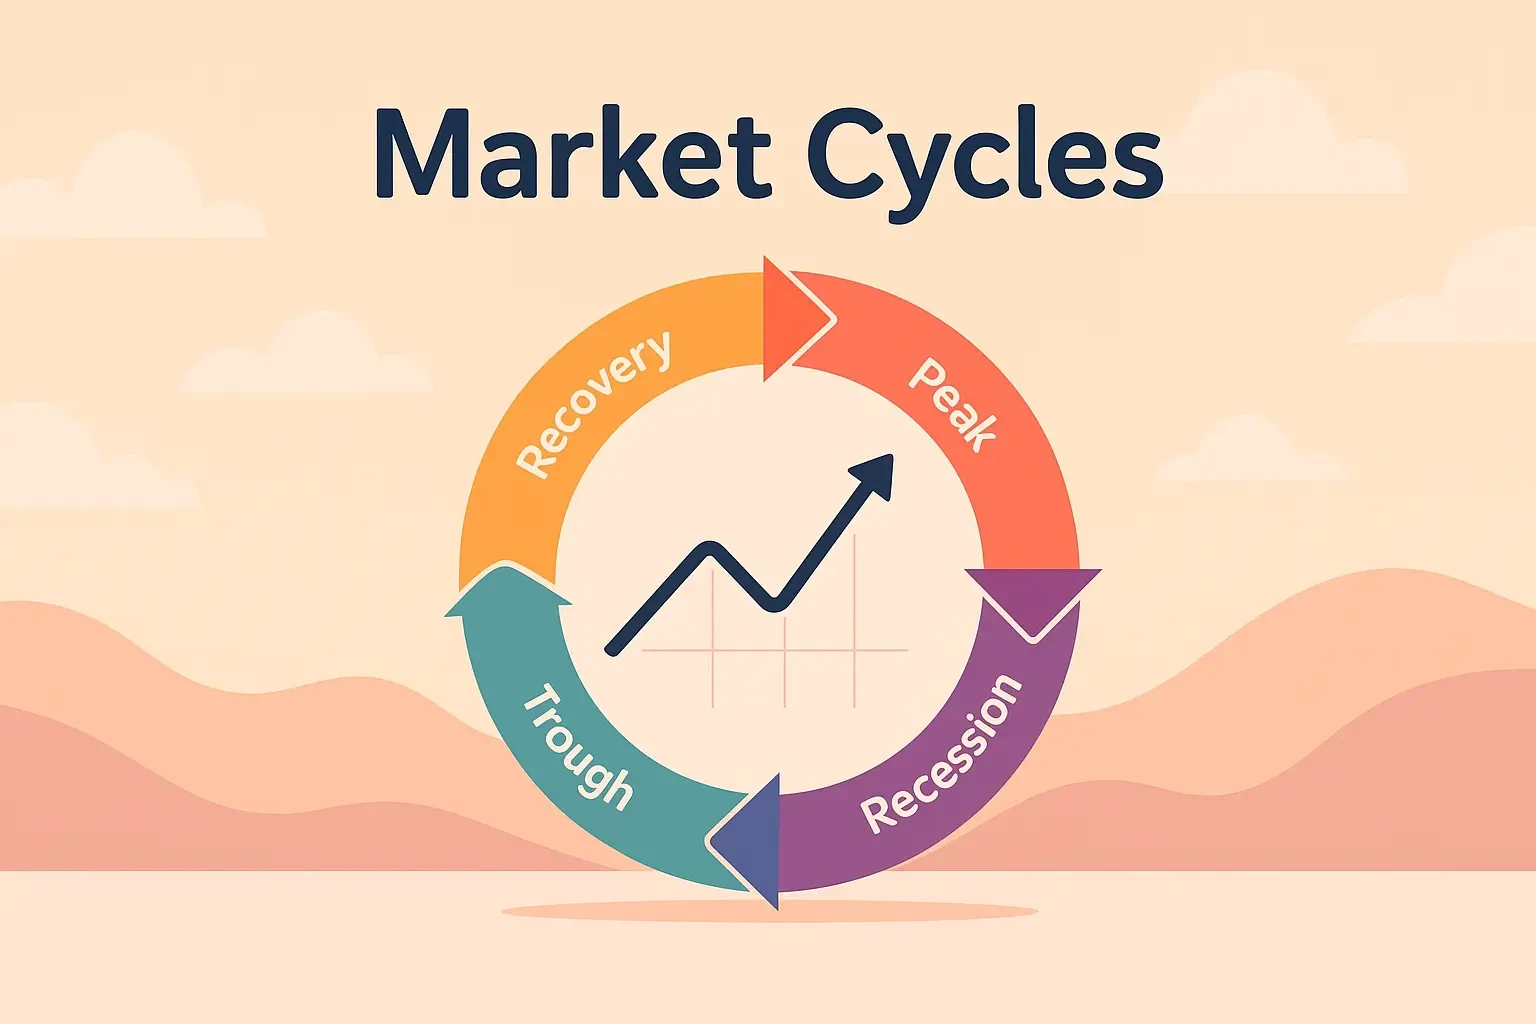
Understanding the Impact of Market Cycles
A huge piece of the risk puzzle is recognizing that markets move in cycles. Nothing goes up in a straight line forever. A big part of evaluating any opportunity is getting a gut feel for where we are in the cycle. This is especially true when you compare different geographic markets.
History gives us clues. Since 1975, data shows that U.S. and international stock markets tend to trade leadership in long, multi-year cycles, often lasting over eight years on average. As of mid-2025, U.S. stocks have been on a tear for roughly 14.3 years—way longer than the historical norm. This doesn’t guarantee a reversal, but it strongly suggests a shift toward international stocks could be on the horizon. If you want to go deeper, the research on geographic market cycles is worth a read.
This cyclical pattern isn't just about U.S. vs. international. Industries and sectors fall in and out of favor, too. Being aware of these larger tides gives you a strategic edge, helping you avoid buying at the top of a hype cycle or panic-selling at the bottom.
Preparing for Inevitable Downturns
To get comfortable with risk, you need to set realistic expectations. Start by looking at historical volatility and drawdowns. A drawdown is simply the measure of a decline from a peak to a trough. If a stock you own has a history of 30% drawdowns, don't be shocked when it happens again. It's not a matter of if, but when.
Expert Tip: Don't just obsess over an asset's average return. Use a tool like PinkLion’s stress testing to simulate how your portfolio might hold up in a real market crash. It’s a powerful way to mentally prepare for volatility and ensure your portfolio is built to withstand a storm, not just perform in sunny weather.
Your best defense against the inevitable is true diversification. And I don’t just mean owning a bunch of different tech stocks. I mean owning assets that behave differently under pressure. A well-built portfolio might combine stocks, bonds, and maybe some alternatives. It’s far more likely to weather a downturn than one concentrated entirely in a single, high-flying sector.
By getting a handle on the types of risk, recognizing the cyclical nature of markets, and building a genuinely diversified portfolio, you can evaluate opportunities with a clear-eyed view of both the potential rewards and the real-world dangers. It's this proactive mindset that builds resilience for whatever the market throws at you next.
Putting It All Together with an Actionable Checklist
We’ve covered a lot of ground—the numbers, the business story, and the risks. But knowledge is only powerful when you actually use it. So, let’s tie all these ideas together into a practical, repeatable checklist you can use every time you evaluate a potential investment.
Think of this less as a rigid set of rules and more as a flexible framework. It works whether you're sizing up a high-flying tech stock or a steady, dividend-paying stalwart. The real goal is to make sure you never skip a critical step, so you can make every decision with clarity and confidence.
The Core Evaluation Checklist
A solid analysis always covers four key areas. Before you even think about hitting the "buy" button, make sure you can confidently answer the questions in each of these buckets. This is how you build a complete picture.
Foundation & Goals: First things first—does this investment actually fit your life? Does it align with your personal timeline and risk tolerance? Will it get you closer to your financial goals, whether that’s retirement, a down payment, or something else?
Quantitative Analysis: Do the numbers tell a good story? Check the core financial metrics like the P/E ratio, Debt-to-Equity, and Return on Equity (ROE). You’re looking for signs of a healthy, profitable, and reasonably valued company. Don't forget to see how these numbers stack up against its closest competitors.
Qualitative Analysis: What's the story behind the numbers? Does the business have a real, durable competitive advantage (what pros call an "economic moat")? Is the leadership team experienced, transparent, and working for shareholders? Are the big-picture industry trends a tailwind or a headwind?
Risk Assessment: What could go wrong here? Identify the biggest threats, both to the company itself and the broader market. Have you looked at its historical volatility and considered how you'd react to a significant price drop?
Applying the Checklist in the Real World
Let's walk through a quick example. Imagine you’re looking at a hypothetical company, "InnovateTech Inc." You've already confirmed it fits your long-term growth goals.
Next, you fire up a tool like PinkLion's analytics dashboard to get the financial vitals in seconds.
The dashboard instantly shows a P/E ratio of 35x, a Debt-to-Equity of 0.2, and an ROE of 22%.
So, what does this tell you? The company is incredibly profitable (22% ROE) and uses almost no debt (0.2 D/E), which is fantastic. But that 35x P/E ratio is a big flag—it means the market has extremely high growth expectations already priced in.
A high P/E isn't an automatic deal-breaker, but it definitely raises the stakes. It means you have to be really confident that InnovateTech’s qualitative strengths—like its patented AI technology and visionary CEO can deliver the explosive growth needed to justify that premium valuation. This is where you blend the hard data with the business story to make a smart decision.
Your Final Sanity Check Before Investing
Even after a fantastic analysis, take a step back and look at the bigger picture. Understanding how markets behave year-to-year is crucial for staying sane.
For instance, the S&P 500's annual returns over the last decade have been all over the place, swinging from a high of +31.5% in 2019 to a low of -18.1% in 2022. But despite the roller coaster, the average return was a solid 13.3%. It’s a powerful reminder that a long-term view smooths out the short-term noise. You can find more details on these historical market performance trends on BusinessInsider.com.
Before you put any money on the line, ask yourself this one final question: "If the stock drops 20% tomorrow for no good reason, would I be more likely to panic-sell or buy more with confidence?" Your honest answer reveals how much conviction you truly have in your research.
Following a system like this also helps you make sense of company announcements over time. For example, by keeping an eye on corporate actions, you can better understand the strategy behind big moves.
Got Questions? Let's Talk specifics
Even with the best framework in hand, a few common questions always seem to pop up when you're in the trenches evaluating an investment. Getting these sticking points cleared up is what gives you the confidence to pull the trigger.
Let's dive into some of the most frequent ones I hear.
How Long Should I Hold an Investment After I've Done My Research?
This one’s simple, but not always easy: your holding period should be tied directly to your original reason for buying.
If you bought a company for its decade-long growth story, then you hold it as long as that story is playing out. Is its competitive advantage still widening? Is the leadership team still executing? If the fundamentals are intact, then short-term market noise is just that—noise.
A good habit is to review your thesis quarterly or annually. The goal is to avoid the classic mistake of selling a fantastic business just because the market is having a temporary tantrum.
If You Could Only Pick One Metric, What Would It Be?
While no single number gives you the full picture, if I were forced to choose, I’d lean heavily on Free Cash Flow (FCF).
FCF tells you how much actual cash a company is pocketing after paying for all its day-to-day operations and investing in future growth.
It's the lifeblood of a business. This is the money used to pay down debt, buy back stock, or hand out dividends, all without needing to borrow a dime. Best of all, it's much tougher to fudge than net income, giving you a clearer view of a company's real financial strength.
How Do I Even Begin to Evaluate a Company in a Brand-New Industry?
When you’re looking at an exciting but unproven space—think AI startups or biotech pioneers—the numbers often aren't there yet. This is where your focus has to pivot almost entirely to the qualitative side.
Here's what you're looking for:
- The People in Charge: Dig into the management team. Do they have a track record of success? Have they ever scaled a business from zero to one hundred? This is non-negotiable.
- The Size of the Prize: How big is this market, really? Get a feel for the total addressable market (TAM) and, more importantly, whether the company has a believable plan to carve out its piece of the pie.
- The Product Itself: Is there a real competitive advantage here? Look for early signs of traction—glowing reviews, a growing user base, or initial sales. Anything that shows people actually want what they're selling.
Remember, these are speculative plays by nature. Keep your position sizes small and be prepared for a bumpy ride.
Are Stock Screeners Worth Using to Find Ideas?
Absolutely. A good stock screener is a powerful tool. It can take a universe of thousands of public companies and instantly filter it down to a manageable list based on your specific criteria, like a P/E ratio under 20 or a debt-to-equity ratio below 0.5.
But—and this is a big but—a screener is just the starting line, not the finish line. It's a fantastic idea generator. Once it gives you a list of potential candidates, that’s when your real homework begins.
Ready to stop guessing and start analyzing with confidence? PinkLion provides all the professional-grade tools you need—from advanced analytics and dividend tracking to AI-powered scenario simulations—in one unified dashboard. Take control of your portfolio by visiting https://pinklion.xyz and start for free.