How to Calculate Dividend Payout Ratio: A Step-by-Step Guide
Learn how to calculate dividend payout ratio with our easy-to-follow guide. Understand key formulas and improve your investment analysis today!

Here's the honest truth: the dividend payout ratio is just a simple metric that shows you what percentage of a company's profit is handed back to shareholders as dividends. It tells a fascinating story about a company's priorities—is it rewarding investors right now, or is it plowing that cash back into the business for future growth?
What the Dividend Payout Ratio Reveals

Forget the textbook jargon for a second. This single number gives you a clear window into a company’s financial health and its game plan.
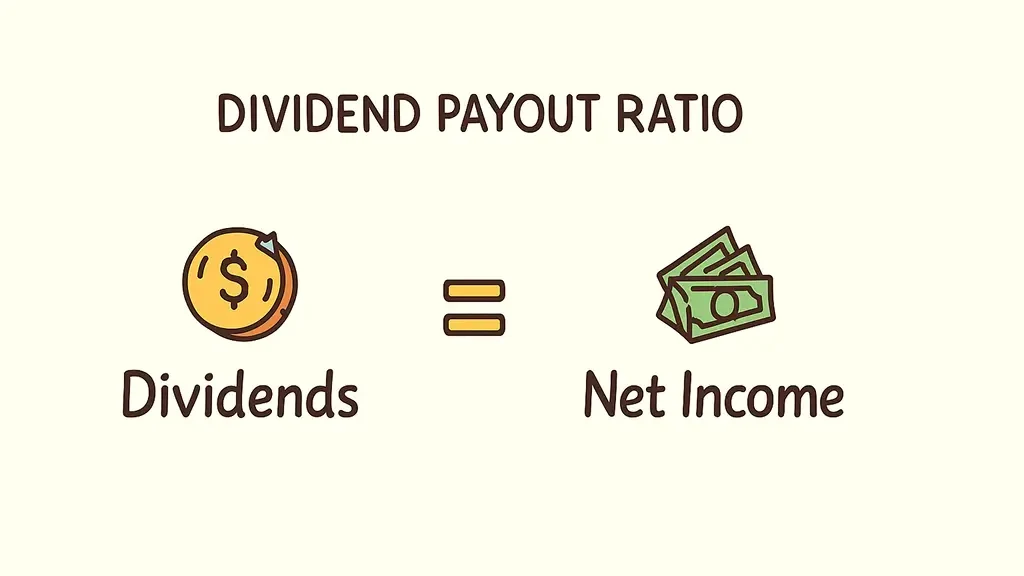
At its core, the calculation is straightforward: you divide the total dividends a company paid out over a period by the net income it earned in that same timeframe. For instance, if a business pocketed $100 million in net income and sent $20 million back to shareholders, its dividend payout ratio is a clean 20%. If you want to get into the weeds of the formula, Wall Street Prep offers a great breakdown.
But that percentage isn't just a number; it’s a narrative. A high ratio might signal a stable, mature business with predictable cash flow, making it a magnet for income-focused investors. It could also, however, be a red flag for unsustainable payments if earnings start to stumble.
Interpreting High vs. Low Ratios
A low ratio often points to a company in growth mode, one that's fueling its own expansion. These businesses keep more of their profits to fund R&D, acquisitions, and new projects. They're prioritizing long-term capital gains over immediate payouts. Think of a hungry tech startup or a biotech firm that needs every dollar to innovate and scale.
On the flip side, a consistently high ratio is common among established players in steady sectors like utilities or consumer staples. Their explosive growth days might be behind them, so they return a hefty chunk of their reliable profits to shareholders.
For an investor, understanding this distinction is crucial. The ratio helps you match your investments to your financial goals—whether you're hunting for steady income or aggressive growth.
This section is all about making the concept intuitive so you can confidently apply it to real-world analysis. By the end, you'll know exactly how to calculate the dividend payout ratio and, more importantly, what that number truly means for your portfolio.
Where to Find the Right Numbers
To calculate the dividend payout ratio, you need to roll up your sleeves and dig into a company's financial filings. It's not as intimidating as it sounds, but you do need to know exactly where to look. Getting comfortable with understanding financial statements is the first step, as these documents are your ground truth.
The two key reports you'll need are the Income Statement and the Statement of Cash Flows. You can find both tucked inside a company's annual report (the Form 10-K) or its quarterly update (the Form 10-Q).
Locating Net Income and Dividends Paid
First, pull up the Income Statement. You're looking for the company's Net Income, which is almost always the bottom-line figure on the page. This number tells you the total profit a company made after every single expense and tax was paid. It’s the "what's left over" part of the equation.
Next, you'll flip over to the Statement of Cash Flows. Scan down to the section labeled "Cash Flows from Financing Activities." In there, you'll spot a line item for "Dividends Paid" or something very similar. This is the crucial number—it shows the actual cash that flowed out of the company's bank account to its shareholders.
Pro Tip: Don't get tripped up by "Dividends Declared." A company can declare a dividend but pay it later. The Statement of Cash Flows gives you the real cash-out-the-door figure, which is exactly what you want for an accurate, real-world calculation.
Using the Per-Share Method
There's another way to tackle this, which some investors find a bit more direct: the per-share method. For this approach, you just need two different metrics:
- Earnings per Share (EPS): You can grab this directly from the Income Statement, usually right below the Net Income line.
- Dividends per Share (DPS): Companies often highlight this number in the summary section of their financial reports, and it's widely available on reputable financial data sites.
For any publicly traded U.S. company, these reports are filed with the Securities and Exchange Commission (SEC) and are publicly available through its EDGAR database.
Here’s a look at the SEC's EDGAR search portal—this is where your research journey begins.
Working with official, audited data straight from the source is non-negotiable. This raw data is the bedrock you'll build on when you evaluate investment opportunities, ensuring you're painting a reliable financial picture of the company.
Calculating the Payout Ratio in the Real World

Alright, let's move from theory to practice. Knowing the formula for the dividend payout ratio is one thing, but the real insights come from applying it to actual companies. It’s the best way to see how this simple metric tells a much bigger story.
We're going to walk through two classic examples: a mature, stable utility company versus a fast-growing tech firm. This contrast is perfect for showing how different business models and industries completely change what a "good" payout ratio looks like. For each, we'll run the numbers both ways to show you get the same answer.
Example 1: The Stable Utility Company
First up, let's picture a well-established utility company we'll call "Evergreen Power." Think predictable revenue, steady demand, and modest growth. Digging into their latest annual report, we find these key figures:
- Net Income: $2 billion
- Total Dividends Paid: $1.4 billion
- Earnings per Share (EPS): $4.00
- Dividends per Share (DPS): $2.80
Using our first formula, we'll divide the total dividends paid by the net income.
$1.4 billion (Total Dividends) / $2 billion (Net Income) = 0.70
That gives us a dividend payout ratio of 70%.
Now, let's double-check it using the per-share data, which is often a quicker route if you have those numbers handy.
$2.80 (DPS) / $4.00 (EPS) = 0.70
Same result: a 70% payout ratio. For a mature utility like this, a number in that ballpark is completely normal. It signals to investors that the company is committed to returning cash to shareholders rather than pouring it all back into aggressive expansion.
A payout ratio in the 50-70% range is often considered healthy for companies in established, low-growth industries. It strikes a good balance between rewarding investors and keeping enough cash for operational stability.
Example 2: The High-Growth Tech Firm
Next, let's switch gears and look at a young tech company, "Innovate Solutions." This firm is in a full-blown growth phase, funneling every spare dollar into R&D and grabbing market share. Unsurprisingly, their financials tell a very different story:
- Net Income: $500 million
- Total Dividends Paid: $75 million
- Earnings per Share (EPS): $5.00
- Dividends per Share (DPS): $0.75
Let's apply the same formulas and see what we get.
$75 million (Total Dividends) / $500 million (Net Income) = 0.15
The calculation spits out a payout ratio of just 15%. This low figure is exactly what you'd expect from a growth-focused company. They're deliberately retaining the vast majority of their earnings—85% in this case—to fuel innovation and scale up. Their investors are banking on future stock appreciation, not immediate dividend checks.
And just to be thorough, let's confirm with the per-share method:
$0.75 (DPS) / $5.00 (EPS) = 0.15
The numbers match perfectly. By putting these two scenarios side-by-side, you can really see that the payout ratio isn't just a number. It's a clear window into a company's strategic priorities.
How to Interpret the Payout Ratio

So you've calculated the dividend payout ratio. You've got a number. Now what? That percentage is useless without context, and the real skill lies in translating it into a smart investment decision.
Let's get one thing straight: there's no single "good" ratio. The right number always depends on the industry, how mature the company is, and what the broader economy is doing.
Don't assume a high payout ratio is an automatic green light. In fact, a ratio soaring over 100% is a massive red flag. It means the company is paying out more in dividends than it's actually earning—a habit that's completely unsustainable and usually funded by debt or by draining cash reserves.
Likewise, a sudden drop in the ratio can spell trouble. It could mean the company is hitting a rough patch and needs to hoard cash, possibly hinting at a future dividend cut. On the other hand, a stable, moderate ratio often signals a healthy balance between rewarding shareholders and reinvesting for future growth.
Benchmarking Ratios Across Industries
Context is everything. A 60% payout ratio might be perfectly healthy for a sleepy utility company but dangerously high for a fast-growing tech firm that needs cash for innovation.
Different sectors have completely different norms. To give you a clearer picture, let's look at some typical ranges.
Typical Dividend Payout Ratios by Industry
Understanding where a company should be is the first step in spotting outliers. This table breaks down what you can generally expect from different corners of the market.
This isn't just trivia; these benchmarks are your guide. They help you quickly assess if a company's dividend policy is reasonable for its industry or if something is off. You can also learn more about how to analyze market trends to put these numbers into a broader economic context.
A company’s payout ratio is a direct reflection of its capital allocation strategy. It tells you whether management prioritizes immediate shareholder returns or long-term business growth. Neither is inherently better—it just depends on what you’re looking for as an investor.
Ultimately, interpreting the payout ratio is less about the number itself and more about the story it tells about a company's financial health, its priorities, and its place in the market.
Common Mistakes to Avoid in Your Analysis

Running the numbers for the dividend payout ratio is just the first step. The real skill is sidestepping the common traps that can lead you to the wrong conclusions. Knowing what not to do is just as important for making smart investment decisions.
The single biggest error I see is analyzing the payout ratio in a vacuum. It’s a powerful metric, no doubt, but on its own, it tells an incomplete story. You have to pair it with other vital signs like free cash flow, debt-to-equity ratios, and the company's overall earnings trend.
Another classic rookie move? Chasing a sky-high dividend yield without checking if the payout ratio is sustainable. A 10% yield looks fantastic until you see the company has a 120% payout ratio. That means it’s borrowing money or draining its savings just to pay you. That’s not a dividend—it’s a ticking time bomb.
Accounting for Irregularities
Financial statements aren't always neat and tidy. One-off events can throw off the numbers and give you a completely distorted picture if you're not paying attention.
For instance, a company might issue a special, one-time dividend after selling off a major asset. This would make its payout ratio skyrocket temporarily. That’s not a sign of instability; it's just an anomaly you need to recognize and account for in your analysis.
On the flip side, a company might use its cash for share buybacks instead of dividends. This can make the payout ratio look artificially low, even when the company is returning tons of value to its shareholders. Always look at the bigger picture of how a company allocates its capital.
Ignoring the context behind the numbers is the fastest way to misinterpret a company's financial health. A high or low ratio is a signal to dig deeper, not a final verdict.
Making sure your analysis is well-rounded is fundamental. This same principle is key when you learn how to diversify your investment portfolio, since relying on single metrics can concentrate your risk. Always cross-reference the payout ratio with other data points before making a move.
Common Questions Answered
Once you start digging into the dividend payout ratio, a few questions always seem to surface. Getting these sorted out is key to avoiding bad assumptions and making smarter investment calls.
One of the first things people ask is, "So, what's a good dividend payout ratio?" The only honest answer is: it depends. A lot. A perfectly healthy 65% ratio for a stable utility company would be a huge red flag for a high-growth tech firm that needs every dollar for R&D.
As a general rule of thumb, a ratio somewhere between 30% and 70% is often considered a sustainable sweet spot for mature, stable businesses.
What if the Ratio Is Over 100 Percent?
This brings us to the next big one: what does it mean when the payout ratio is over 100%? If you see this, it’s time to pay close attention. It means a company is dishing out more cash in dividends than it's actually earning.
That's just not sustainable. To cover the shortfall, the company is probably funding those dividend checks by:
- Draining its cash reserves
- Selling off assets
- Taking on new debt
None of those are great long-term solutions. A ratio that stays above 100% for more than a quarter or two is often a warning shot that a dividend cut is on the horizon, which can send the stock price tumbling.
Think of it like a personal budget. If you're consistently spending more than you make each month, you're on a fast track to financial trouble. A company with a payout ratio over 100% is doing the exact same thing on a corporate scale.
Can the Payout Ratio Be Negative?
Finally, what happens when the math gives you a negative number? This pops up when a company pays a dividend but posts a net loss for the period (meaning negative earnings per share). In short, the company is losing money but still sending out dividend checks.
Just like a ratio over 100%, this is a sign of potential financial distress. The company is funding its dividend from sources other than current profits, which should make you question both the dividend's safety and the management team's decision-making.
Tired of crunching numbers by hand? PinkLion offers advanced dividend tracking and forecasting tools that automatically calculate these critical metrics for you. Consolidate all your accounts in one place and get the clear insights you need to build wealth with confidence. Start your free PinkLion trial today.
