Decoding the Portfolio Turnover Ratio for Investors
Understand the portfolio turnover ratio and its impact on your returns. Learn how this key metric reveals a fund's strategy, costs, and tax efficiency.

Ever wonder how active your fund manager really is? The portfolio turnover ratio is the metric that tells you just that. It measures how often the assets inside an investment fund are bought and sold.
A high ratio means the manager is trading frequently, while a low one points to a more classic "buy-and-hold" strategy.
Understanding the Portfolio Turnover Ratio

Think of a fund manager like the general manager of a sports team. One manager might be constantly trading players, always chasing the next hot prospect. Another might carefully build a roster and stick with it for the long haul, trusting in their core picks.
The portfolio turnover ratio is the scorecard that tells you which kind of manager is running your fund. It’s a simple but revealing metric that shows the percentage of a portfolio's assets that have been replaced over a one-year period.
For example, a turnover ratio of 100% means the fund effectively sold and bought a whole new set of holdings within the year. On the flip side, a 5% turnover ratio means only a tiny fraction of the assets were traded. For a deeper dive into the numbers, check out this guide from the Corporate Finance Institute.
The Story It Tells About a Fund's Strategy
This single number gives you instant clues about a fund's investment philosophy. It’s more than just data; it’s a window into the manager's mindset.
- High Turnover (e.g., above 100%): This usually signals an aggressive, actively managed fund. The manager is likely trying to time the market, jump on short-term price swings, or react quickly to breaking news.
- Low Turnover (e.g., below 30%): This suggests a more passive or value-oriented approach. The manager is making deliberate, long-term bets on companies they believe will grow steadily over time, tuning out the short-term market noise.
Knowing the difference is critical because the level of trading activity has direct consequences for your wallet.
A fund's turnover rate is a critical piece of due diligence. It directly impacts two of the most important factors for an investor: the costs you pay and the taxes you owe.
Why This Ratio Matters to Your Bottom Line
A high-turnover fund can feel like a whirlwind of constant activity, and that activity isn't free. Every trade racks up transaction costs, like brokerage commissions and bid-ask spreads. While small on their own, these fees can pile up and create a drag on your overall returns. It's like paying a small service charge every time a player is traded on your favorite team—it adds up fast.
Even more important is the tax impact. Frequent selling can trigger capital gains, especially short-term gains, which are taxed at higher rates. A fund with a low turnover ratio, in contrast, tends to have lower trading costs and is far more tax-efficient, letting more of your money stay invested and compound over time. This foundational knowledge is your first step toward interpreting the numbers and asking the right questions.
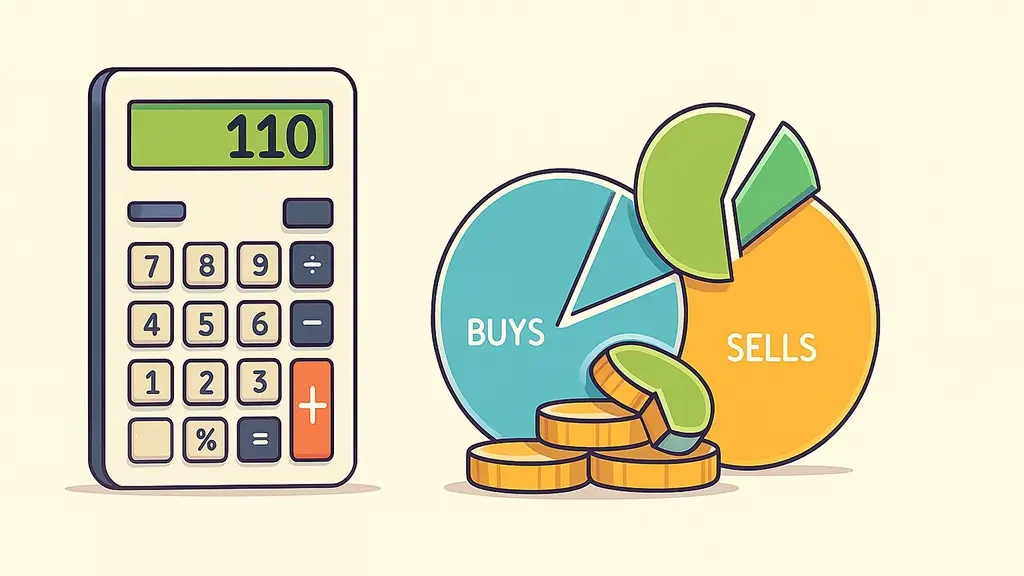
Calculating the Portfolio Turnover Ratio Step by Step
To really get what the portfolio turnover ratio tells you, it helps to look under the hood. Don't worry, it's not some intimidating financial formula. The calculation is actually quite straightforward and logical, designed to give you an honest picture of a fund’s trading activity.
The formula itself is simple:
Portfolio Turnover Ratio = (The Lesser of Total Purchases or Total Sales) / Average Assets Under Management (AUM)
This equation measures how much of the portfolio was traded relative to its total size over a specific period—almost always one year. Let's break down each piece to see how it all works.
Gathering the Key Ingredients
Before we can crunch the numbers, we need three key pieces of information, which you can typically find in a fund's annual report:
- Total Purchases: The total dollar value of all securities the fund manager bought during the year.
- Total Sales: The total dollar value of all securities the fund manager sold during the year.
- Average Assets Under Management (AUM): The average total value of all the assets in the fund over that same year. We use an average to prevent the final number from getting skewed by a single day's market high or low.
Once you have these three figures, you're ready to see the manager's strategy in action.
The Logic Behind "The Lesser Of"
The most important part of this formula is using the lesser of either total purchases or sales in the top half of the equation. This isn't just a random rule; it’s a clever way to make sure the ratio measures genuine trading, not just a fund getting bigger or smaller.
Imagine a popular new fund that gets $500 million in fresh cash from investors. The manager uses this cash to buy new securities, so "Total Purchases" is $500 million. If the fund didn't sell anything, "Total Sales" would be $0.
If the formula just added up all transactions, it would look like there was massive turnover. But by using the lesser value ($0 in this case), the formula correctly shows that the core portfolio wasn't "turned over"—it just grew. This is how the calculation isolates the deliberate act of replacing existing assets, which is what turnover is all about.
A Practical Calculation Example
Let's put it all together with a hypothetical mutual fund, the "Lion's Share Growth Fund." Here are its numbers for the past year:
- Average Assets Under Management (AUM): $2 billion
- Total Securities Purchased: $800 million
- Total Securities Sold: $600 million
First, we find the lesser of purchases or sales. In this case, $600 million (total sales) is less than $800 million (total purchases). So, $600 million is the number we'll use for the numerator.
Now, we just plug it into the formula:
- Portfolio Turnover Ratio = $600,000,000 / $2,000,000,000
- Portfolio Turnover Ratio = 0.30
To turn that into a percentage, we just multiply by 100. The Lion's Share Growth Fund has a portfolio turnover ratio of 30%. This means the manager replaced holdings equal to 30% of the fund's average value over the year, suggesting a relatively patient, long-term approach. Once you understand the calculation, you can start to see the story behind the number.
What Is a Good Portfolio Turnover Ratio?
When you start digging into investment metrics, it’s tempting to search for a single "good" number. But with the portfolio turnover ratio, there’s no magic figure that signals a healthy fund across the board.
Instead, a “good” ratio is one that aligns perfectly with the fund's stated mission and your own investment philosophy.
Think of it like comparing vehicles. You wouldn't expect a heavy-duty truck designed for hauling massive loads to have the same fuel economy as a zippy hybrid built for city commuting. Each is good at its specific job. In the same way, a fund’s turnover ratio has to be judged in the context of its strategy.
A high turnover isn't automatically bad, and a low one isn't necessarily good. The real question is whether the trading activity—and the costs that come with it—is actually justified by the fund's performance and goals.
Benchmarks for Different Fund Strategies
To make sense of the numbers, it helps to have a few general benchmarks in mind. A low turnover ratio, typically under 30%, is the hallmark of a passive investment strategy. This is what you’d expect from index funds that simply aim to mirror a market index like the S&P 500, which requires very little trading.
On the flip side, a high portfolio turnover ratio, often over 100%, signals an aggressive, actively managed strategy. Here, the fund manager is buying and selling frequently, trying to beat the market by jumping on short-term opportunities. This approach is common in funds focused on high-growth sectors or those using momentum-based trading tactics.
A fund's turnover ratio is like its pulse. A calm, steady pulse (low turnover) fits a long-distance runner's strategy, while a rapid pulse (high turnover) suits a sprinter trying to win a short race. Neither is wrong, but you need to know which race you've entered.
Comparing Ratios Across Fund Types
The ideal turnover rate varies dramatically depending on the kind of fund you’re looking at. A growth fund manager might trade often to capture emerging trends, while a value fund manager may hold undervalued stocks for years, waiting patiently for the market to recognize their true worth. This strategic difference naturally creates very different turnover rates.
Building a balanced collection of assets is a critical skill for any investor. You can learn more in our detailed guide on how to diversify an investment portfolio.
To give you a clearer picture, here’s a quick breakdown of what to expect from different fund categories. This table can help you set realistic expectations when you’re scanning a fund's prospectus.
Typical Portfolio Turnover Ratios by Fund Type
Having these benchmarks makes it easier to spot when something might be off.
When to Raise a Red Flag
While context is everything, there are times when a portfolio turnover ratio should definitely make you pause. A high ratio in a fund that claims to follow a long-term, buy-and-hold strategy is a major red flag. This could be a sign of "strategy drift," where the manager isn't actually sticking to the fund's stated philosophy.
Even more telling is a persistently high turnover ratio that isn't matched by superior, benchmark-beating returns. In this case, all that frequent trading is just generating costs and taxes that eat into your profits without delivering any real value. Essentially, you're paying for activity, not for performance.
The best approach is to never analyze the ratio in isolation. See it as one piece of a much larger puzzle. With tools like PinkLion, you can track not just a fund's turnover but also its historical performance, expense ratio, and overall fit within your portfolio. This holistic view is what empowers you to decide if a fund's trading habits truly serve your financial interests.
The Hidden Costs of a High Turnover Ratio

A high portfolio turnover ratio isn’t just a number on a fact sheet; it’s a warning sign. It tells you the fund manager is trading constantly, and all that activity creates a financial drag that can quietly eat away at your returns.
Think of it like this: a speedboat zipping across the water burns a ton of fuel with every sharp turn. A steady cargo ship, on the other hand, uses far less fuel to reach the same destination. For your investment, that "fuel" comes in two main forms: transaction fees and taxes.
The Slow Leak of Transaction Costs
Every single time a fund manager buys or sells a stock, the fund pays for it. These costs aren't broken down on your statement, but they directly chip away at the fund's net asset value (NAV). A high portfolio turnover ratio means these costs are happening over and over again.
- Brokerage Commissions: These are the straightforward fees paid to execute a trade. Even with institutional pricing, a fund making thousands of trades a year racks up some serious commission expenses.
- Bid-Ask Spreads: This is the tiny gap between what buyers are willing to pay and what sellers are willing to accept. For every trade, the fund loses a fraction to this spread, which acts like a hidden tax on every transaction.
- Market Impact Costs: When a large fund buys or sells a huge number of shares, its own actions can move the stock's price. A massive buy order can drive the price up, and a large sell order can push it down, forcing the fund to get a worse price than it wanted.
Each cost seems small on its own. But for a fund with a 150% turnover, it's paying these fees on one-and-a-half times its entire asset base, every single year. That creates a constant headwind the fund must fight just to keep up with a quieter, low-turnover competitor.
The Tax Man Cometh: Short-Term Capital Gains
Here’s the biggest hidden cost, especially if you’re investing in a taxable account: taxes. When a fund sells an asset it has held for one year or less, any profit is a short-term capital gain.
This is a critical detail because short-term gains are taxed at your ordinary income tax rate—the same rate you pay on your paycheck. That can be as high as 37% federally, not including state taxes.
Profits from assets held for more than a year, however, are considered long-term capital gains. These are taxed at much friendlier rates: 0%, 15%, or 20%, depending on your income.
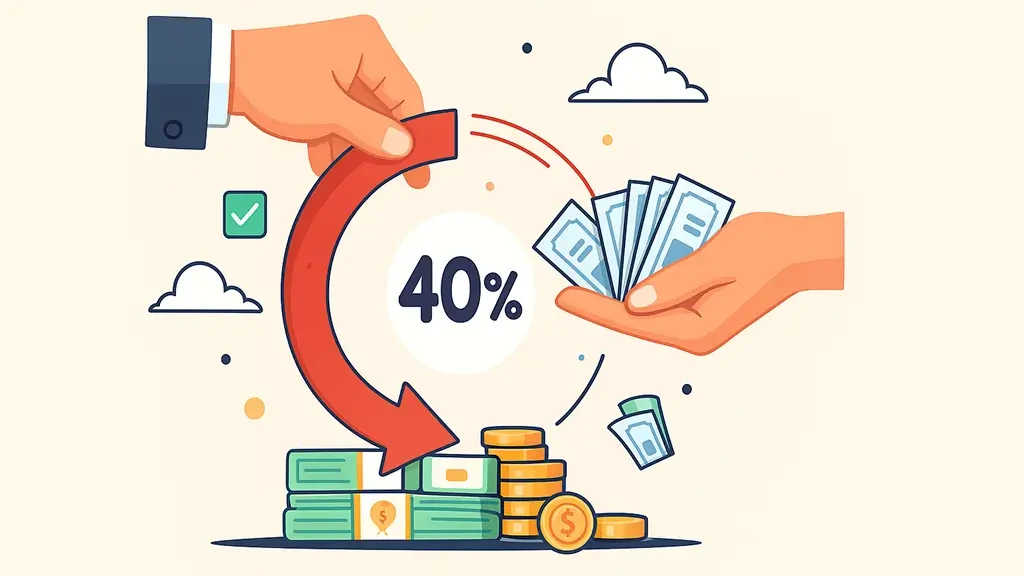
A fund with high turnover is constantly hitting the reset button on its holdings. By selling so quickly, it forfeits the massive tax advantages of long-term investing and passes that higher tax bill straight to you.
This means a hyperactive fund has to generate much higher returns before taxes just to deliver the same after-tax result as a more patient, tax-efficient fund.
A Tale of Two Funds
Let's make this crystal clear with a simple comparison. Imagine two funds, Fund A and Fund B. Both earned a 10% pre-tax return for the year. The only thing separating them is their trading style.
Even with identical on-paper performance, Fund B put an extra 1.5% directly into the investor's pocket. The frenetic trading of Fund A created a tax drag that vaporized a huge chunk of its gains.
This is the real-world impact of the portfolio turnover ratio. When you're picking a fund, you're not just looking at its growth potential; you're also checking for leaks.
Historical and Global Perspectives on Turnover
To really get a feel for the portfolio turnover ratio, you have to understand that it’s not some static, universal number. What’s considered "high" or "low" is constantly in motion, shaped by everything from technology to national investing habits. Today's norms are just a snapshot in a much longer, more interesting story.
Think about it: the very pace of trading has ebbed and flowed dramatically over the decades. Back in the mid-20th century, before index funds were a household name and active management was the only game in town, trading activity could be incredibly frenetic. It was a completely different world.
For example, research into U.S. stock trading from that era uncovered some wild figures. In the 1950s and 60s, it wasn't unheard of for funds to hit turnover rates that would make even a modern day-trader blush. One fund, in 1953, clocked a mind-boggling 2,500% turnover rate. That means the average stock was held for just 2.1 weeks. Let that sink in.
The Technological Shift to High-Frequency Trading
Of course, the single biggest game-changer has been technology. We've gone from traders in colorful jackets shouting on a physical floor to algorithms executing millions of orders in the blink of an eye. This shift didn't happen overnight; it was a series of crucial steps.
- Decimalization: Remember when stocks were priced in fractions like 1/8th of a dollar? The switch to decimals in 2001 seems small, but it massively narrowed the bid-ask spread, making it cheaper to trade in and out of positions frequently.
- The Rise of Online Brokerages: The internet blew the doors open for retail investors. Suddenly, anyone with a computer could trade with a click, flooding the market with new activity and liquidity.
- Algorithmic Trading: This was the final leap. Sophisticated computer programs can now operate at speeds humans can't even comprehend, creating an entire class of ultra-high turnover strategies that pull the market's average turnover rate higher.
This tech-fueled evolution created an environment where hyperactive trading isn't just possible—it’s a profitable business model for some. It stands in stark contrast to the old-school investment philosophies that preached long-term, patient ownership.
Global Differences in Investor Culture
Zooming out from history, you’ll also find that turnover isn't the same everywhere. Different countries have their own unique investing cultures, regulatory quirks, and market structures that shape how often assets change hands.
The U.S. markets, for instance, are famous for their high liquidity and a deeply ingrained culture of active management. There’s a relentless focus on quarterly earnings and short-term performance, which naturally encourages higher turnover.
But in other parts of the world, things can look quite different:
- European Markets: In countries like Germany or Switzerland, you'll find a stronger tradition of "patient capital." Big institutional investors and founding families often hold huge stakes in companies for generations. That long-term view keeps turnover naturally lower.
- Asian Markets: Here, it’s a mixed bag. Some markets, like Japan, historically had a lot of institutional cross-holding (where companies own shares in each other), which puts a damper on trading. In contrast, other markets in the region can see huge spikes in speculative retail trading, sending turnover rates through the roof temporarily.
These global nuances are more than just trivia; they add a crucial layer of context. They remind us that the portfolio turnover ratio is a reflection of the economic climate and investment culture of a specific time and place. Keeping this bigger picture in mind is essential when you're building a durable portfolio, especially when using frameworks like the ones in our guide on what is modern portfolio theory.
How to Use This Metric as an Investor
Knowing the theory behind the portfolio turnover ratio is one thing, but actually putting it to use is what makes you a smarter investor. This metric isn't just another number buried in a fund’s paperwork; it’s a powerful lens you can use to examine a fund's real-world strategy, its hidden costs, and whether it truly fits your goals.
Let's turn that data into real insight. It boils down to knowing where to find the number and, more importantly, what questions to ask once you have it. This is how you move from theory to making confident decisions with your money.
Finding and Evaluating the Ratio
First things first: you need to track down the portfolio turnover ratio. You can usually find it in a fund's official documents or on any good financial website.
- Fund Prospectus: This is your primary source. Look in the "Financial Highlights" or "Fees and Expenses" sections.
- Annual or Semi-Annual Reports: These will give you the most current turnover numbers and the fund manager's commentary on them.
- Financial Data Platforms: Sites like Morningstar, Yahoo Finance, or specialized tools like PinkLion display this metric right on a fund's main summary page, making it easy to spot.
Once you’ve got the number, the real work begins. The biggest mistake you can make is looking at it in a vacuum. A turnover of 80% might be completely normal for an aggressive, fast-moving small-cap fund, but it would be a massive red flag for a fund that claims to be a stable, long-term value investor. Context is everything.
The portfolio turnover ratio doesn’t give you a simple "good" or "bad" answer. Instead, it pushes you to ask smarter, more critical questions about whether a fund’s actions align with its promises—and if it respects your after-tax returns.
Critical Questions to Ask
When a fund’s turnover looks suspiciously high or low compared to its peers, it's time to put on your detective hat. The answers will tell you a lot about the fund manager's true style and whether the fund really belongs in your portfolio. To get started, check out our comprehensive guide on how to evaluate investment opportunities.
Use these three questions as your go-to checklist:
- Does the turnover actually match the fund's stated strategy? A high turnover in a "buy-and-hold" value fund signals a serious disconnect between what the manager says and what they do.
- Does the fund's performance justify all that trading? If a manager is constantly buying and selling, the returns after taxes and fees should be consistently beating the benchmark and its low-turnover rivals. If not, you're just paying for activity, not results.
- How does this ratio stack up against the category average? Use PinkLion’s benchmarking tools to see if the fund is an outlier. A big difference from the average means you need to dig deeper into the manager’s approach.
At the end of the day, the portfolio turnover ratio is just one piece of the puzzle, but it's a crucial one. Always analyze it alongside the expense ratio, the manager’s tenure, and long-term performance to get the full picture of what you’re buying into.
Got Questions About Portfolio Turnover?
Even after getting the basics down, a few common questions always pop up about the portfolio turnover ratio. Let's tackle them head-on, so you can use this metric with more confidence when you’re sizing up a fund.
Is a High Turnover Ratio Always a Bad Thing?
Not necessarily. A high turnover ratio is an instant red flag for higher trading costs and potential tax bills, which is why it gets such a bad rap. But a big number isn’t an automatic deal-breaker if the fund manager is actually delivering the goods.
An active manager might justify a high turnover by generating returns that more than cover those extra fees and taxes. The real question is whether the fund’s net performance—after all costs are paid—consistently beats its benchmark and its peers. If all that activity leads to outperformance, it’s a strategy that works.
A high turnover is only "bad" when it leads to high costs without delivering high performance. Always judge it by the net results it puts back in your pocket.
Do ETFs Usually Have Lower Turnover Than Mutual Funds?
Typically, yes. Most Exchange-Traded Funds (ETFs) are built to passively track an index, like the S&P 500. By its very nature, that’s a low-turnover strategy. The fund only really needs to buy or sell when the index itself changes, which isn't very often.
But the investing world is never quite that simple. Actively managed ETFs are out there, and they can churn their portfolios just as much as their mutual fund cousins. The key difference is structural: the way ETF shares are created and redeemed often makes them more tax-efficient than mutual funds, even if they have similar trading levels.
Can a Fund Really Have a 0% Turnover Ratio?
It’s extremely rare, but technically, yes. A 0% portfolio turnover ratio means the fund manager didn’t sell a single holding all year. The fund might have bought new securities using cash from new investors, but none of the existing assets were touched.
This signals a pure, hardcore buy-and-hold strategy. You might see this in a brand-new fund during its first year or in a very rigid fund that’s prohibited from selling by its mandate. For most established funds, even the passive ones, a 0% ratio is pretty much unheard of.
Gain a complete understanding of your investments with PinkLion. Our platform helps you track metrics like the portfolio turnover ratio, analyze hidden costs, and see the real-world impact on your returns. Take control of your financial future by signing up for free at PinkLion.