What Is Beta in Stocks? Essential Guide to Risk & Return
Learn what is beta in stocks, how it measures risk, and why it matters for your investments. Get clear insights to improve your trading decisions.


In the world of investing, you'll hear the term beta thrown around a lot. So, what is it?
Simply put, beta measures a stock's volatility—or price swings—relative to the overall market. Think of it as a risk compass. It tells you how much you can expect a stock to move up or down for every 1% move in the market (which is typically benchmarked against an index like the S&P 500).
A stock with a beta of 1.0 tends to move in lockstep with the market. If the S&P 500 goes up 10%, that stock should, in theory, go up about 10% too. A beta above 1.0 signals higher volatility, while a beta below 1.0 means it's more stable.
Understanding Beta: A Stock's Volatility Compass

Let's try an analogy. Imagine the stock market is a powerful ocean current.
Some stocks are like speedboats. When the current is strong and moving forward, they zip ahead even faster. But when the waters get choppy, those same speedboats get tossed around violently. These are your high-beta stocks.
Other stocks are more like steady barges. They move slowly and surely, less affected by the turbulence. They won't win any races, but they're also less likely to capsize in a storm. These are your low-beta stocks.
Beta is the number that tells you whether you’re investing in the speedboat or the barge. It quantifies a stock's sensitivity to those market currents, giving you a crucial glimpse into its risk profile.
Interpreting Beta Values
So, now that we know What Is Beta in Stocks, how do we use it? It all comes down to interpreting the number itself. By definition, the market (like the S&P 500) has a beta of exactly 1.0. Every other stock is measured against that baseline.
Here’s a quick breakdown of what different beta values signal:
- Beta = 1.0: The stock's price moves right alongside the market. It's perfectly correlated, on average.
- Beta > 1.0: The stock is more volatile than the market. A stock with a beta of 1.5, for example, would theoretically jump 50% more than the market on the way up—and fall 50% more on the way down.
- **Beta < 1.0** (but > 0): The stock is less volatile than the market. You'll often find mature companies in stable industries here, like utilities or consumer staples. They're the barges.
- Beta = 0: The stock's movement is completely unrelated to the market. This is rare for a single stock but common for assets like cash.
- Beta < 0 (Negative Beta): The stock tends to move in the opposite direction of the market. A classic example is a gold mining stock, which might rally when the broader market sells off during a panic.
For a quick reference, here's how to think about beta at a glance.
Interpreting Beta Values At a Glance
This table provides a quick summary of different beta values and what they indicate about a stock's risk and volatility compared to the market.
| Beta Value | Interpretation | Volatility vs. Market | Example Stock Type |
|---|---|---|---|
| > 1.0 | Aggressive | More Volatile | High-growth tech, cyclical stocks |
| = 1.0 | Market Neutral | Same Volatility | S&P 500 index fund (e.g., SPY) |
| 0 to 1.0 | Defensive | Less Volatile | Utilities, consumer staples |
| < 0 | Counter-Cyclical | Moves Oppositely | Gold miners, certain hedge funds |
Ultimately, this all comes down to matching your portfolio to your personality and goals.
By understanding a stock's beta, you can better align your investments with your personal risk tolerance. An aggressive investor might seek out high-beta stocks for potentially higher returns, while a conservative investor may prefer low-beta stocks for their stability.
If you're looking for more detail, there are plenty of great resources out there. For another excellent perspective on this important metric, check out this guide: What Is Beta in Stocks.
How Stock Beta Is Actually Calculated
While beta feels like a simple number, there’s a bit of statistical wizardry happening behind the scenes. The good news is you don’t need to be a math whiz to grasp the logic. At its core, beta comes from comparing a stock's historical price swings to those of a market benchmark, like the S&P 500, usually over a three to five-year period.
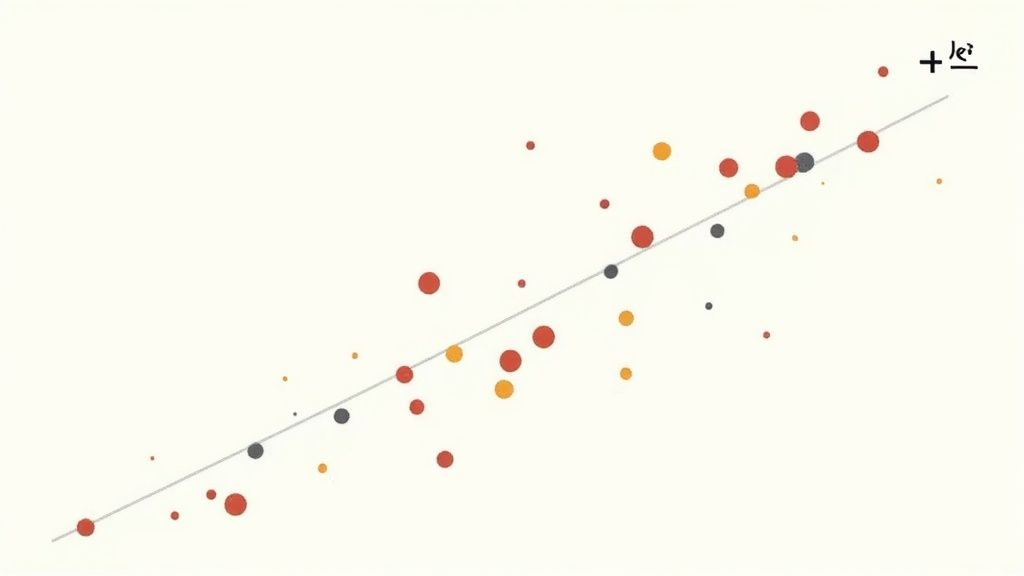
Imagine plotting these movements on a graph. The market’s daily returns go on the horizontal axis (the x-axis), and the individual stock's returns are on the vertical axis (the y-axis). Each dot on the graph represents a single day, showing you exactly how the stock moved when the market moved.
Once you have this cloud of dots—a scatter plot—a relationship starts to emerge. The next step is to draw a single straight line that best fits the overall trend of these points. The slope of this "best-fit" line is the stock's beta. A steep slope means a high beta (more volatile), while a flatter slope points to a low beta (less volatile).
The Core Ingredients: Covariance and Variance
So, how do we find that slope? The formula uses two key statistical ingredients: covariance and variance. Let’s strip away the jargon.
- Covariance: This tells us how two things move together. In our case, it answers the question, "When the S&P 500 zigs, does our stock tend to zig with it?" A positive covariance means they generally move in the same direction.
- Variance: This measures how much a single thing—the market, in this case—bounces around its own average. It’s a pure measure of the market’s own volatility, or its total "noise."
The beta formula is simply the covariance of the stock and the market, divided by the variance of the market. This calculation cleverly isolates how much of a stock's movement is tied to the market's own drama.
R-Squared: A Confidence Score for Beta
But how much can you trust this beta number? Not all betas are created equal, which is where another metric, R-squared, comes in. R-squared is a value between 0 and 100 that reveals how much of a stock's price movement can be explained by what the market is doing.
Think of it as a confidence score. A high R-squared (say, 85) means the stock is a loyal follower of the market index, making its beta a very reliable indicator of its risk. On the other hand, a low R-squared (like 25) suggests that company-specific news and other factors are the real drivers of its price, making its beta far less meaningful.
Statistically, beta is the output of a regression analysis that measures a stock's returns against market returns, with the regression line's slope representing beta. R-squared tells us how well that line fits the data, signaling how much of the stock's performance beta actually explains. A higher R-squared means beta is a bigger piece of the puzzle.
Understanding where beta comes from is fundamental to building smarter portfolios. It's a cornerstone concept in broader investment frameworks, which you can dive into in our guide on what is modern portfolio theory.
Putting Beta Into Practice With Real-World Examples

Theory is one thing, but seeing beta in action with real companies makes the concept truly click. Once you start looking at the business models behind the stocks, you develop an intuitive feel for why their beta is high, low, or even negative. It’s the bridge between the numbers on a screen and the real-world forces that drive a stock's performance.
Let's break down a few classic examples.
The High-Beta Growth Stock: NVIDIA
Tech giant NVIDIA (NVDA) is a perfect poster child for high beta, often clocking in well above 1.0—sometimes as high as 1.7. In plain English, that means for every 1% move the S&P 500 makes, NVIDIA has historically moved about 1.7% in the same direction. So, why the extra volatility?
It all comes down to its business. NVIDIA operates at the bleeding edge of high-growth, forward-looking sectors like artificial intelligence, gaming, and cloud computing.
- Fueled by Innovation: A huge chunk of NVIDIA's value is tied to expectations of future breakthroughs. When the market is optimistic, investors pile in, sending the stock soaring. But at the first hint of a slowdown or a competitor catching up, that optimism can evaporate just as quickly.
- Cyclical Demand: Its high-end GPUs aren't cheap. In a booming economy, businesses and consumers are happy to spend big on the latest and greatest tech. During a recession, however, those expensive upgrades are often the first things to get postponed.
This extreme sensitivity to economic sentiment and future hopes makes NVIDIA a classic high-beta stock. Investors are making a big bet on massive future growth, a wager that naturally amplifies both market rallies and downturns.
The Low-Beta Defensive Stock: Procter & Gamble
Now, let’s flip to the other side of the coin. A consumer staples titan like Procter & Gamble (PG) typically carries a beta well below 1.0, often hovering around 0.4 to 0.6. This tells us its stock is far less jumpy than the broader market.
The reason is rooted in its brilliantly boring business model. P&G sells the stuff we all need, regardless of what the economy is doing: Tide laundry detergent, Crest toothpaste, and Pampers diapers.
A low-beta stock's stability often comes from consistent, non-discretionary consumer demand. People buy toothpaste and toilet paper in both economic booms and busts, which insulates companies like Procter & Gamble from the market's wildest swings.
This predictable demand creates a defensive moat around the company's earnings. Sure, P&G probably won't deliver the eye-popping gains of a tech darling during a bull run. But its resilience offers a valuable anchor of stability during market storms, making it a classic "defensive" holding for a reason.
The Negative-Beta Hedging Asset: Gold
Finally, we have the rare and fascinating case of negative beta. While you won't see it often in individual operating companies, assets like gold mining stocks can sometimes move in the opposite direction of the market.
Take a company like Barrick Gold (GOLD). When does it tend to do well? Usually, it's during times of widespread market fear, recession, or geopolitical chaos. In those moments, investors often flee from stocks and pile into "safe-haven" assets. And gold is the quintessential safe haven.
So, when the S&P 500 is tanking, the demand for physical gold often rises, which in turn can boost the stock prices of the companies that mine it. This inverse relationship makes negative-beta assets a powerful tool for portfolio diversification. They can act like a financial life raft, potentially floating higher precisely when the rest of your portfolio is sinking.
The Hidden Risks of Relying on Beta

While beta is a fantastic tool for seeing how a stock dances with the market, treating it as an infallible crystal ball is a huge mistake. Its biggest weakness is glaringly simple: beta is backward-looking. It’s calculated using old price data, and the past is never a perfect predictor of the future.
A company's risk profile isn't set in stone; it changes. This is where relying on beta alone can get you into trouble, because it’s great at measuring one kind of risk but is completely blind to another.
Systematic vs. Unsystematic Risk
The world of investing risk really boils down to two types. Nail down the difference, and you'll immediately see where beta falls short.
- Systematic Risk: This is the big-picture, market-wide risk that beta was born to measure. Think of things like a recession, a sudden interest rate hike, or a major geopolitical crisis. You can't diversify this away because it pulls almost everything down with it. It’s the tide that lifts or sinks all boats.
- Unsystematic Risk: This is the company-specific stuff that beta completely ignores. We’re talking about a failed clinical trial for a biotech firm, a massive product recall, a nasty accounting scandal, or a surprise lawsuit. These are isolated storms that can wreck a single company's stock, even while the rest of the market is enjoying clear skies.
Because beta only cares about how a stock moves with the market tide, it tells you absolutely nothing about the potential for a company-specific disaster to strike. This is the single biggest blind spot when you ask, "what is beta in stocks?"
Beta quantifies how a stock reacts to broad market movements (systematic risk) but offers zero insight into dangers unique to the company itself (unsystematic risk). Relying on it alone is like checking the weather for the whole region but ignoring a forecast for a localized tornado heading straight for your house.
When a Low Beta Fails to Protect You
A single real-world event can make a stock's historical beta totally irrelevant overnight.
Look at what happened with PG&E Corporation. As a utility company, it traditionally had a sleepy, low beta of around 0.5. For years, investors saw it as a safe, steady investment that was far less volatile than the market.
Then came the catastrophic 2018 Camp Fire in California.
Facing unimaginable legal and financial liabilities, the company's stock went haywire. This crisis was entirely specific to PG&E; its old correlation with the broader market was meaningless. Suddenly, its reputation as a "safe" low-beta stock was shattered by a company-specific catastrophe.
This is a powerful reminder that a stock’s beta can shift dramatically when its fundamentals change. A once-stable business can become highly speculative due to new competition, a leadership shake-up, or a black-swan event.
This is why experienced investors don't just rely on historical metrics. Using tools like scenario simulations can help stress-test a portfolio against these kinds of unexpected shocks. You can explore this further in our guide to using Monte Carlo simulations for financial planning. At the end of the day, beta is just one piece of a much larger puzzle.
Using Beta to Build a Smarter Portfolio
Knowing what beta means is the first step, but putting it to work is how you get a real edge. This metric isn't just a boring number on a screen—it's a practical tool for building a portfolio that actually matches your financial goals, timeline, and gut-level comfort with risk. By mixing and matching stocks based on their beta, you can start to steer your portfolio's overall volatility.
For aggressive investors chasing higher growth, especially in a bull market, high-beta stocks can feel like hitting the accelerator. A portfolio deliberately tilted towards stocks with betas above 1.2 or 1.3 is engineered to amplify a rising market. This strategy is a bet on continued economic tailwinds, aiming to magnify gains.
On the flip side, conservative investors focused on capital preservation or steady income can use low-beta stocks as a defensive anchor. By loading up on companies with betas below 1.0, they build a portfolio designed to hold up better during downturns. These holdings are often stable dividend-payers that provide a cushion against market turbulence.
Calculating Your Portfolio Beta
An individual stock's beta is helpful, but what really counts is your portfolio's overall beta. This single number gives you a snapshot of your entire portfolio's risk relative to the market. The good news? You don't need fancy software to figure it out. The calculation is a simple weighted average.
Here’s the process:
- Figure out the weight of each stock in your portfolio. If you have a $10,000 portfolio and $2,000 is in Stock A, its weight is 20%.
- Multiply each stock's weight by its individual beta. If Stock A has a beta of 1.5, its weighted contribution is 0.20 * 1.5 = 0.30.
- Add up the weighted betas for all of your holdings. That total is your portfolio beta.
For example, a simple two-stock portfolio might look like this:
- Stock A (60% of portfolio) with a beta of 1.5 -> Weighted Beta = 0.90
- Stock B (40% of portfolio) with a beta of 0.5 -> Weighted Beta = 0.20
- Total Portfolio Beta = 0.90 + 0.20 = 1.10
This portfolio is slightly more volatile than the market as a whole.
A portfolio's beta isn't set in stone; it changes every time you buy or sell an asset or as market values fluctuate. Calculating it regularly helps you make sure your risk level stays aligned with your strategy, so you don't end up with any nasty surprises.
Connecting Beta to Expected Returns
Beta does more than just measure volatility; it's a key ingredient in one of finance's most foundational tools for estimating an investment's expected return: the Capital Asset Pricing Model (CAPM).
The CAPM formula basically argues that you should be paid more for taking on more market risk. It starts with a baseline "risk-free" rate (think of a government bond yield) and then adds a premium based on the stock's beta. A higher beta implies higher systematic risk, which, according to the model, should translate to a higher expected return over the long haul to make that risk worthwhile.
This link makes beta a critical tool not just for managing swings, but for setting realistic expectations for performance. A core principle of smart portfolio construction is balancing high- and low-beta assets. For more on this, check out our guide on how to diversify an investment portfolio. Once you get the hang of beta, you’re well on your way to building a more resilient and goal-oriented financial future.
Frequently Asked Questions About Stock Beta
Even after you get the hang of beta, a few common questions always seem to pop up once you start putting it to work. Let's clear up any lingering confusion with some straight answers to the most frequent queries.
Can a Stock Have a Negative Beta and What Does It Mean?
Absolutely, though it’s pretty rare to see. A stock with a negative beta moves in the opposite direction of the broader market.
Think of it this way: if the S&P 500 climbs 1%, a stock with a beta of -0.5 would, in theory, dip by 0.5%. On the flip side, if the market tumbles, this stock is expected to rise. Assets like gold mining stocks or inverse ETFs sometimes behave this way. Investors love them as portfolio hedges because they can zig when the market zags, helping soften the blow during downturns.
Where Can I Find the Beta of a Stock?
Finding a stock's beta is easy. It’s a standard metric you’ll find on almost any major financial data site, like Yahoo Finance, Google Finance, Bloomberg also PinkLion.
Just pull up a stock's summary or statistics page, and you'll usually see it listed. Your own brokerage platform likely shows it, too. One small detail to watch for is the timeframe used for the calculation (like a 3-year or 5-year beta), as this can cause slight differences from one source to another.
Is a Low Beta Stock Always a Good Investment?
Not necessarily. A low beta just means the stock is less volatile than the market, which is great for risk-averse investors who want a smoother ride. But low volatility doesn't automatically equal a high-quality company.
A business can have a low beta but still suffer from weak fundamentals, poor growth prospects, or be stuck in a dying industry. A stock that doesn’t fall much when the market tanks might not climb much during a rally, either.
Beta is a measure of systematic risk—the risk tied to the market—not a complete report card on an investment. Always pair it with a hard look at the company’s actual financial health and future potential.
What Is the Difference Between Beta and Standard Deviation?
Both are key risk metrics, but they measure different things. Getting the distinction right is crucial for a full picture of risk.
- Beta measures systematic risk. It tells you how a stock’s price moves in relation to the overall market. It’s all about its sensitivity to market-wide events.
- Standard Deviation measures total risk. This includes both market risk (systematic) and company-specific risk (unsystematic). It quantifies how much a stock's return bounces around its own average.
In short, beta tells you how a stock dances with the market. Standard deviation tells you how wildly the stock dances on its own, regardless of what the market is doing. It's entirely possible for a stock to have a low beta but a high standard deviation if its price swings are driven by company-specific news, not market trends.
Ready to take control of your portfolio with professional-grade tools? PinkLion offers advanced analytics, AI-powered scenario simulations, and stress-testing to help you build a smarter, more resilient investment strategy. Consolidate all your accounts and gain the clarity you need to achieve your financial goals. Start for free at PinkLion.