Track and Analyze Your Portfolio with Precision

Get insights into your investments, monitor performance, and make data-driven decisions—all in one place.
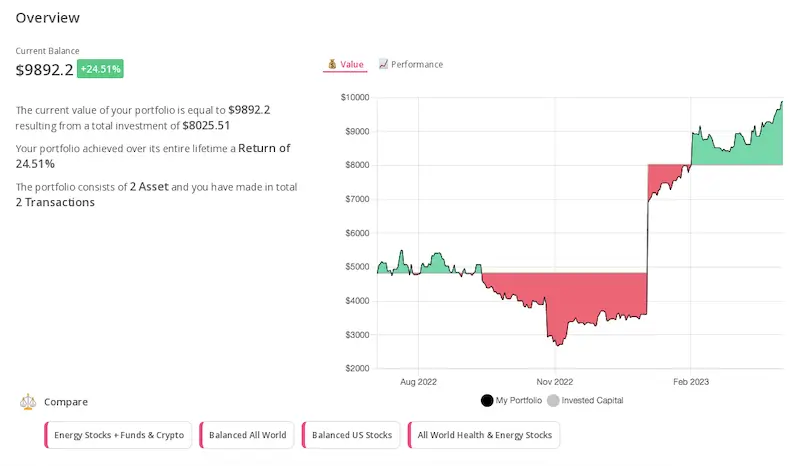
All Your Investments, All in One Place

Track all your accounts, asset classes, and investments in one centralized place. From stocks to ETFs and crypto, see your complete financial picture at a glance.
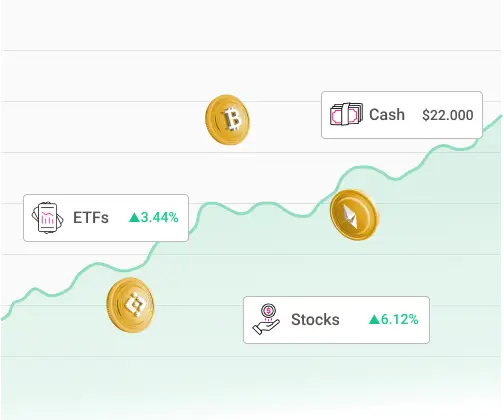
  • Daily updates across all accounts and asset types.
  • Consolidated view of portfolio performance, diversification, and risk.
  • Compatible with major brokers for seamless integration.
A portfolio summary screen showing a total portfolio value with a breakdown of asset types (stocks, crypto, ETFs), along with performance indicators like daily change and 1-year return.
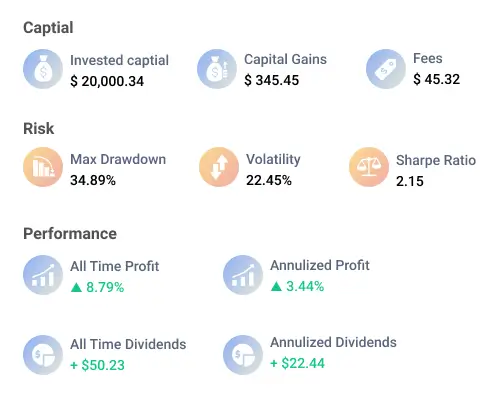
A detailed analytics view featuring a diversification pie chart, a bar graph showing sector exposure, and a table of key metrics like Sharpe ratio, volatility, and annualized return.

Understand What Drives Your Portfolio

Dive deep into your portfolio’s performance with advanced analytics. Track key metrics like diversification, sector exposure, and risk/reward ratios to stay ahead in the market and optimize your strategy.

  • View detailed sector and asset class breakdowns.
  • Analyze diversification to identify potential gaps or overexposures.
  • Monitor risk/reward ratios to align with your goals.

Spot Patterns in Your Portfolio Performance

Understand how your investments evolve over time with historical performance tracking and trend analysis. Easily spot patterns, identify high-performing assets, and make informed decisions for future growth.
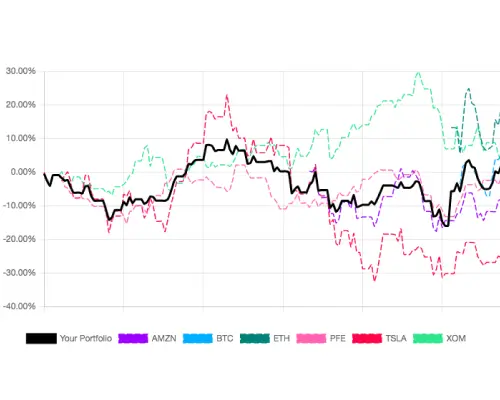
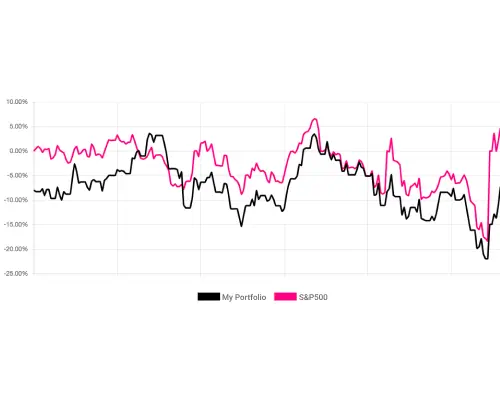
  • View historical performance data across your entire portfolio.
  • Identify trends and patterns that impact returns.
  • Spot high-performing assets and areas for improvement.
A radar chart showing a balanced portfolio with metrics like volatility, diversification, and projected return. Include visual prompts suggesting actionable improvements, like “Reduce exposure to X for better diversification.
A line graph showing portfolio performance over the last year, with highlights marking key milestones (e.g., highest return, lowest point). Include annotations such as “Strong Growth Period” or “Underperformance Detected.”

See How You Measure Up

Compare your portfolio’s performance against major indices or custom benchmarks. Gain valuable insights into how your investments are performing relative to the market, helping you make smarter adjustments.

  • Benchmark portfolio performance against indices like the S&P 500 or Nasdaq.
  • Evaluate insightful benchmarks for more advanced portfolio analytics.
  • Identify strengths and weaknesses in your investment strategy.