12 Best Free Stock Analysis Software for 2025
Discover the 12 best free stock analysis software platforms of 2025. Compare top tools for charting, screening, and portfolio management to invest smarter.

In today's dynamic market, making informed investment decisions is more critical than ever. Gone are the days when sophisticated analytical tools were reserved for Wall Street professionals. A wealth of powerful, free stock analysis software now exists, offering everything from advanced charting and technical indicators to comprehensive portfolio tracking and AI-powered forecasting. However, navigating this landscape can be overwhelming. How do you distinguish between a basic stock ticker and a robust analytical platform? Which tools are genuinely free, and what are the hidden limitations?
This guide cuts through the noise. We will provide a detailed breakdown of the 12 best free stock analysis software options available, evaluating their core strengths, practical use cases, and honest limitations. We've done the research to help you move beyond simple price-watching and into meaningful analysis that can sharpen your investment thesis. To broaden your understanding of cost-effective solutions beyond stock analysis, you might find value in exploring other powerful free software alternatives that can help reduce costs across your digital life.
Each entry in our list includes screenshots and direct links to get you started immediately. Whether you're a technical trader seeking charting perfection, a long-term investor focused on fundamentals, or a portfolio manager needing a holistic view, you'll find a tool here to elevate your strategy without impacting your budget. Our goal is to equip you with the insights needed to select the right platform for your specific investment style, helping you find the signal in a market full of noise. Let's dive in and find the perfect free tools to enhance your portfolio.
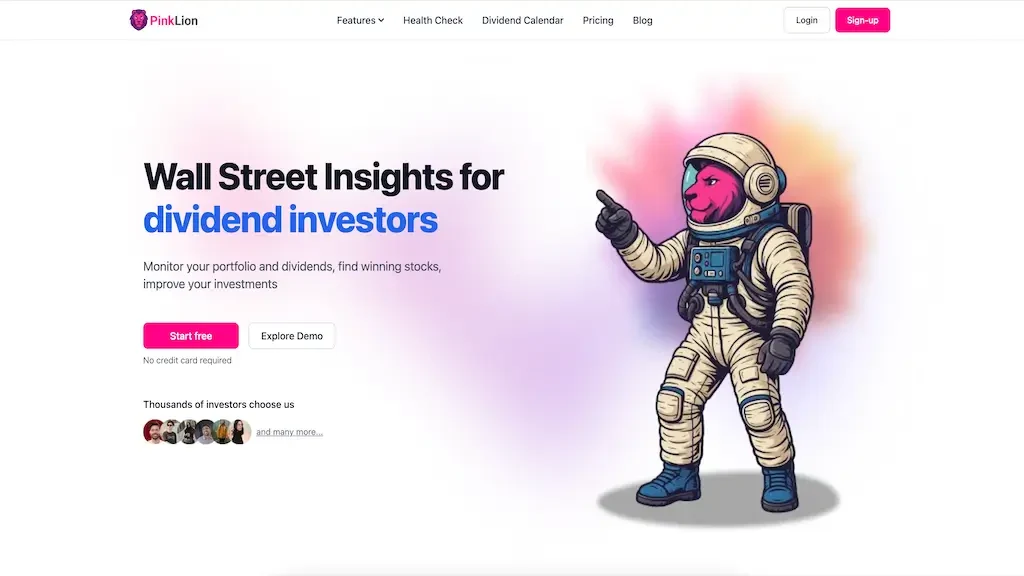
1. PinkLion
PinkLion distinguishes itself as an exceptionally powerful, all-in-one portfolio management and analysis platform, earning its place as our featured choice for the best free stock analysis software. It moves beyond basic stock tracking to offer a holistic view of your entire financial picture, consolidating holdings from multiple brokerage accounts including stocks, ETFs, and even cryptocurrency into a single, elegant dashboard. This seamless integration provides unparalleled clarity, allowing retail investors to see exactly how their assets perform together.
The platform's strength lies in its professional-grade analytical tools, which are made accessible to the average investor. Rather than just presenting raw data, PinkLion empowers users with forward-looking, AI-driven simulations. You can stress-test your portfolio against potential market downturns or use 1-year forecasting models to visualize growth potential based on expert estimates and market data. This capability transforms analysis from a reactive exercise to a proactive strategic planning tool.
Key Features and User Scenarios
- Unified Portfolio Tracking: PinkLion automatically syncs with your brokers, eliminating manual entry. This is ideal for investors with assets spread across multiple platforms who need a single source of truth for their net worth and performance.
- AI-Powered Forecasting: Use scenario simulations to model how your portfolio might react to specific economic events. This is invaluable for risk-conscious investors looking to build a more resilient, all-weather portfolio. For a deeper dive into this type of analysis, you can learn how to analyze market trends with their guide.
- Advanced Dividend Management: Income-focused investors will appreciate the detailed dividend calendars and cash-flow monitoring tools. These features help you track expected income and optimize your reinvestment strategy for compounding growth.
- Intuitive Interface & Community: The platform is designed to be user-friendly for all experience levels and is supported by an active Slack community, providing a collaborative environment for learning and support.
Practical Assessment
Pros:
- Comprehensive, multi-asset consolidation (stocks, ETFs, crypto).
- Sophisticated AI tools like stress-testing and forecasting.
- Excellent dividend tracking and cash-flow management.
- Sleek user interface suitable for beginners and experts.
Cons:
- Pricing for premium features is not listed publicly.
- Primarily tailored for retail investors, not institutional clients.
Access: You can start for free without a credit card at https://pinklion.xyz.
2. TradingView
TradingView is a powerhouse in the world of financial analysis, renowned for its sophisticated, browser-based charting platform. It has become a go-to resource for traders and investors alike due to its blend of powerful technical analysis tools, a vast social network, and an intuitive user interface, solidifying its place as one of the best free stock analysis software options available. Its primary strength lies in its charting capabilities, which are fast, responsive, and highly customizable even on the free plan.
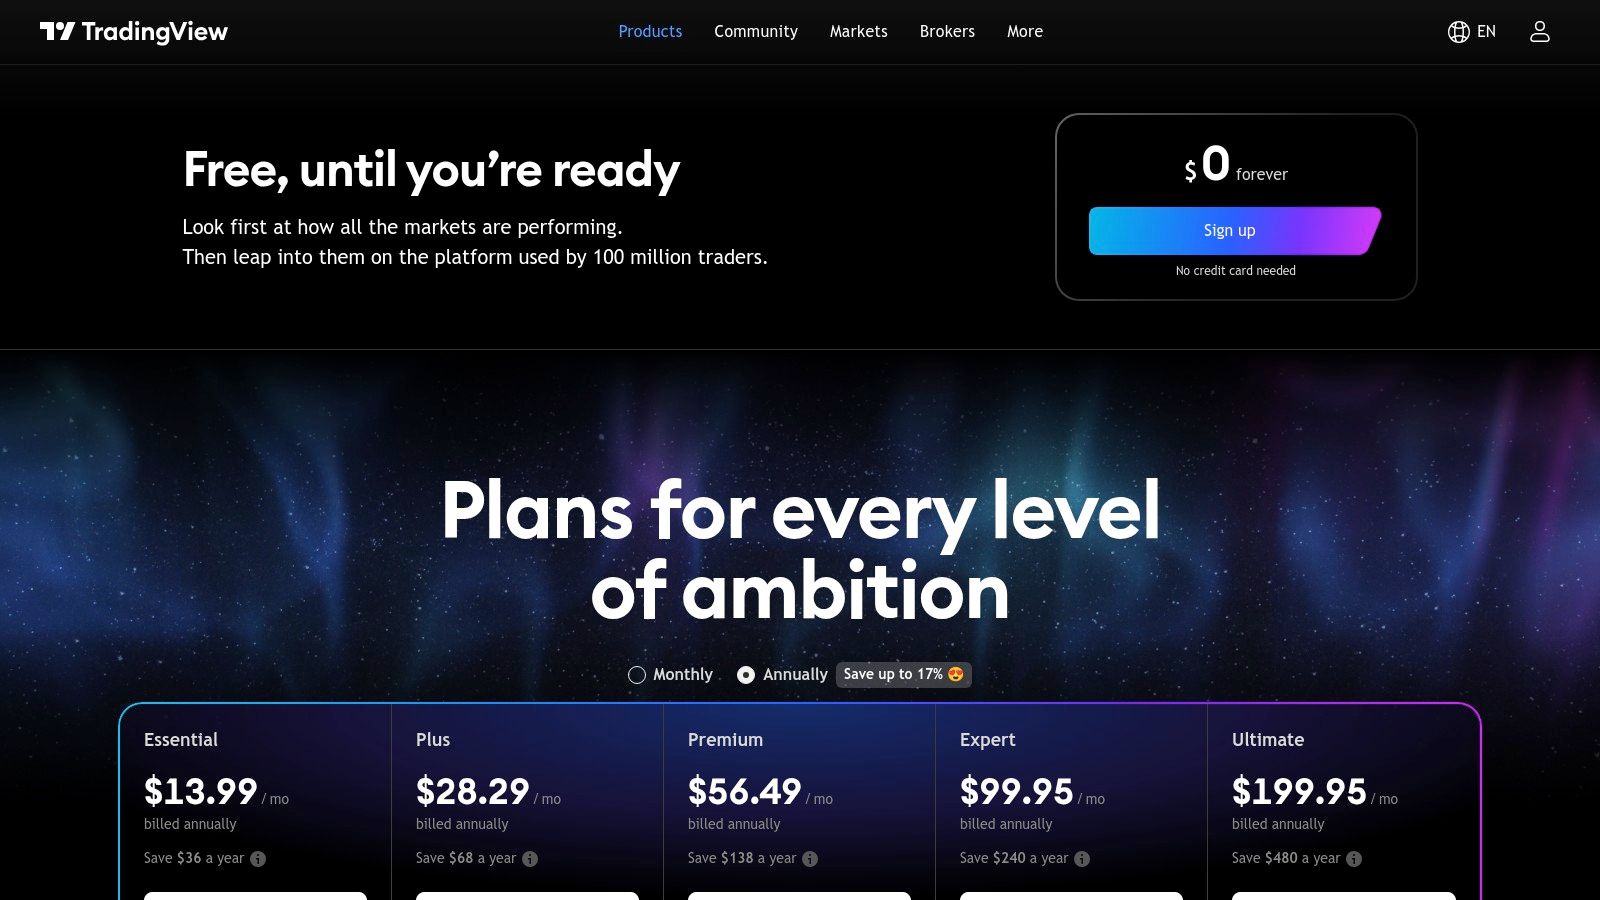
The platform is more than just charts; it’s a community. Users can publish their own analyses, share trading ideas, and even create custom indicators using the proprietary Pine Script language. This social integration provides a continuous stream of insights and educational content directly within the platform. The free "Basic" plan is impressively robust, offering access to most markets, advanced charting, and powerful stock screeners.
Key Features & Limitations
Practical Tip: Leverage the "Ideas" stream to see how other investors are analyzing a stock you're interested in. It’s a fantastic way to discover new perspectives or learn new technical analysis techniques. However, remember the free plan’s limitations, such as ads and a cap on indicators, which may prompt active users to consider a paid subscription.
- Website: https://www.tradingview.com/pricing/
3. Yahoo Finance
Yahoo Finance has long been a household name and a foundational resource for retail investors, making it an indispensable part of any list of the best free stock analysis software. It serves as a comprehensive financial portal, offering a reliable blend of real-time U.S. market data, breaking news, and fundamental analysis tools. Its user-friendly interface makes it exceptionally accessible for beginners, while the depth of its free features provides substantial value for more seasoned investors.
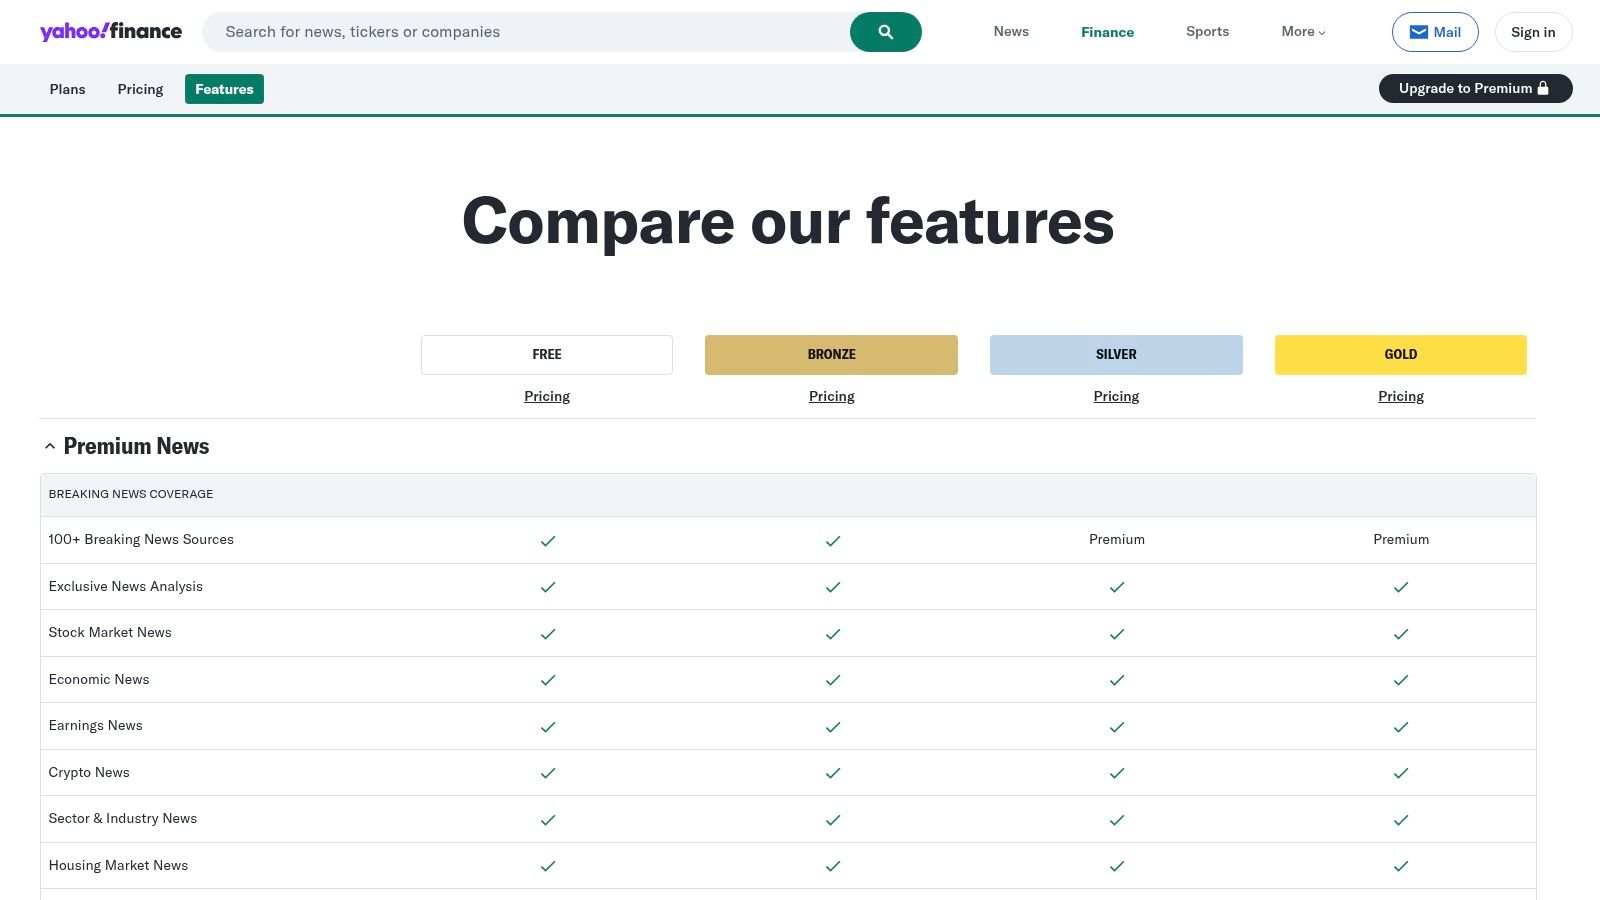
The platform excels at integrating key company information, such as financial statements, analyst ratings, and corporate filings, directly alongside interactive charts and news feeds. This holistic view allows users to quickly grasp both the quantitative and qualitative aspects of a company. While its free charting tools are more basic than specialized platforms like TradingView, they are more than adequate for standard analysis and are complemented by robust stock, ETF, and options screeners.
Key Features & Limitations
Practical Tip: Use Yahoo Finance as your primary hub for fundamental research. The "Statistics" and "Financials" tabs for any given stock provide a wealth of information that is crucial for understanding a company’s health. By combining this data with the platform’s integrated news, you can form a well-rounded view, which is a key step when you evaluate investment opportunities. Be mindful that the free version is ad-supported and gates its most powerful features behind a subscription.
4. Finviz
Finviz excels at one thing above all else: speed. It’s a powerful, web-based market scanner that allows investors to sift through thousands of stocks using a vast array of technical and fundamental filters in seconds. Its interface is designed for rapid information processing, presenting data through highly visual formats like heat maps and bubble charts, making it an exceptional tool for generating new trade ideas quickly. This focus on efficient, data-dense visualization solidifies its reputation as a top-tier free stock analysis software.
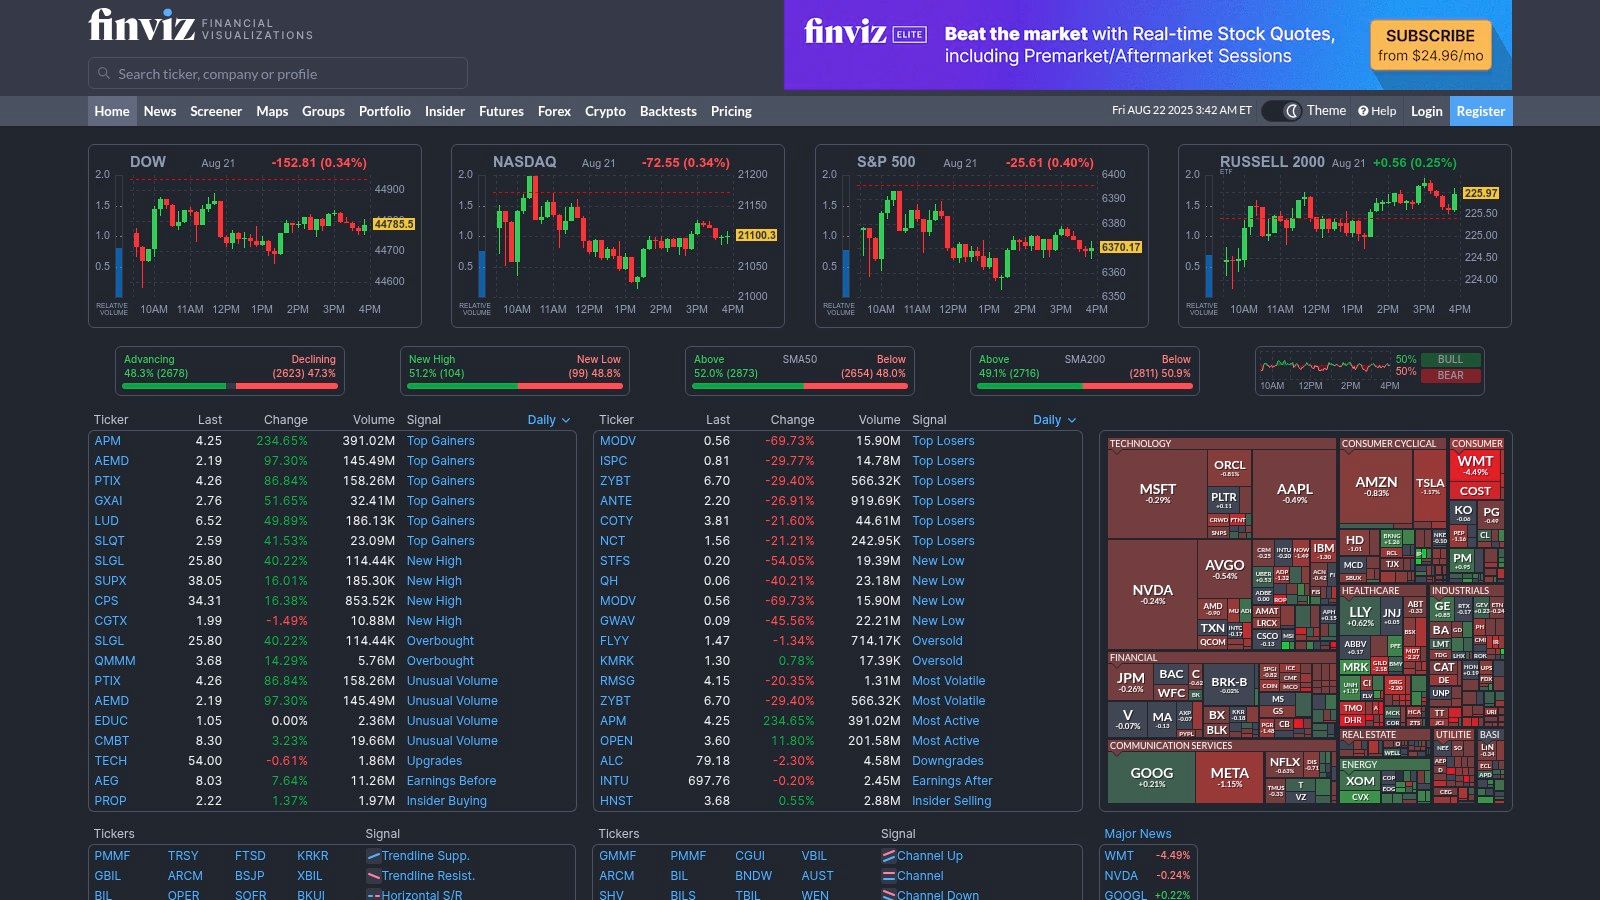
The platform’s core strength is its screener, which is remarkably comprehensive on the free plan. Users can combine dozens of criteria, from P/E ratios and dividend yields to candlestick patterns and RSI values, to pinpoint stocks that meet their exact strategy. While the charts are more basic than a dedicated platform like TradingView, Finviz complements this with aggregated news feeds, insider trading data, and institutional ownership information, providing a well-rounded snapshot of any given stock.
Key Features & Limitations
Practical Tip: Use the "Groups" tab to quickly identify the best and worst-performing industries for the day, week, or month. This can help you spot broad market trends and find stocks with momentum without needing to run a complex screen. Remember that the free version has ads and uses delayed quotes, so it’s best for research and idea generation rather than real-time trading decisions.
- Website: https://finviz.com/
5. Koyfin
Koyfin positions itself as a modern, all-in-one market analytics platform, aiming to provide institutional-grade data and tools with a user-friendly interface. It excels at combining high-level macroeconomic data with detailed company-specific financials, making it a strong contender for the best free stock analysis software for investors who want a holistic market view. Its dashboard-centric approach allows users to quickly get up to speed on market trends, sector performance, and individual stock vitals in one clean space.
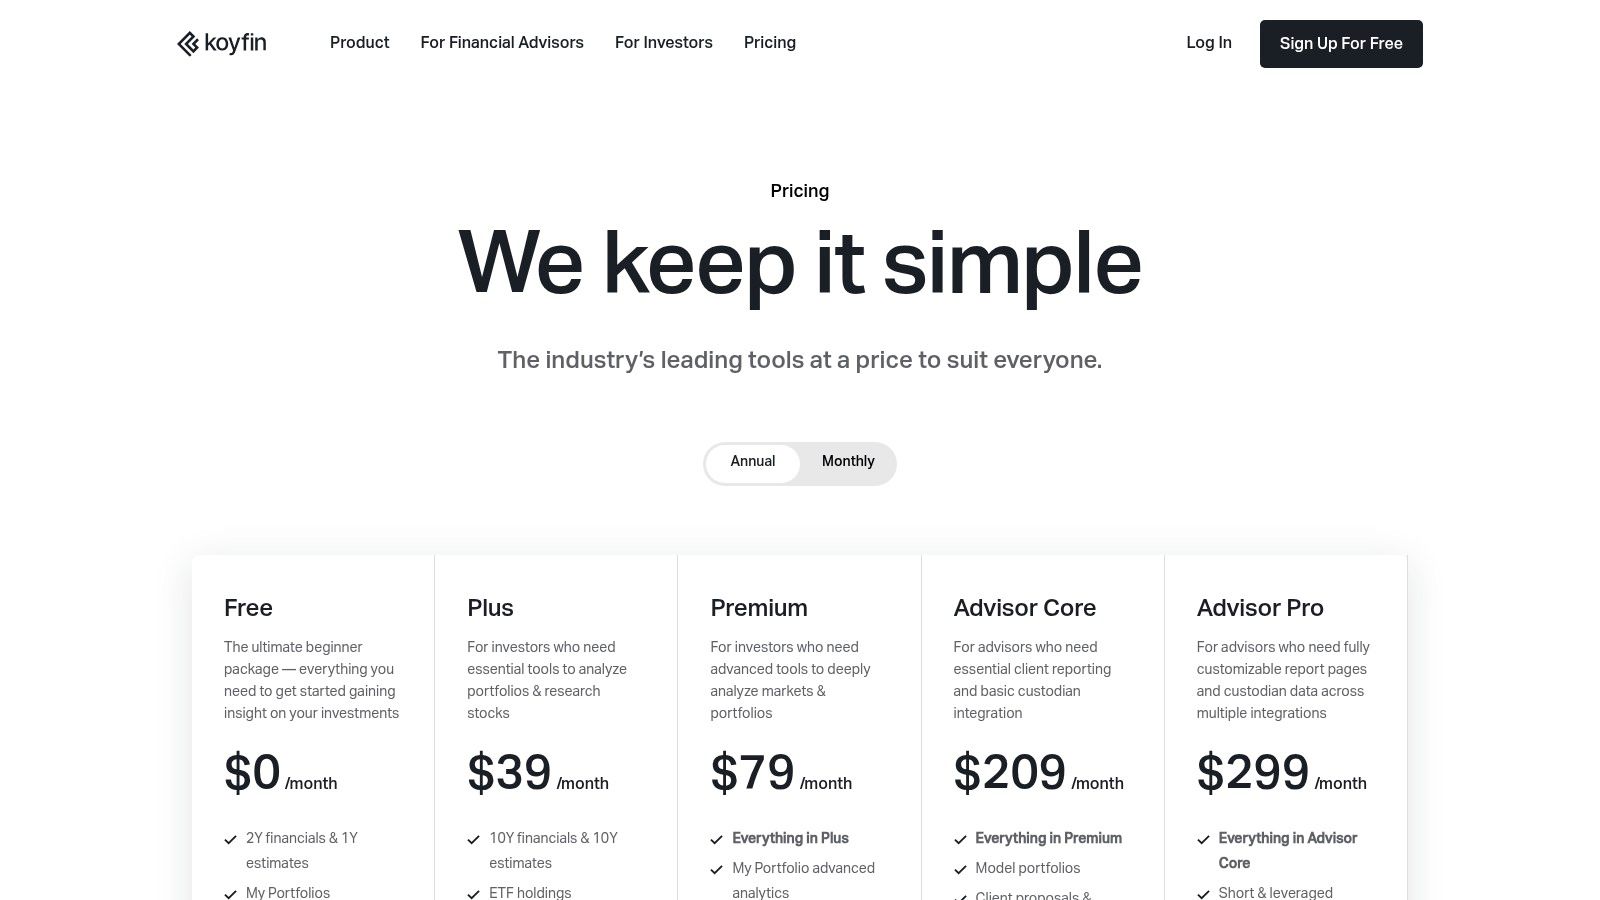
The platform is particularly useful for fundamental analysis, presenting financial statements, valuation metrics, and analyst estimates in a visually intuitive way. Unlike platforms that are purely focused on charting, Koyfin’s strength lies in integrating diverse data sets. The free plan is quite generous, offering access to most dashboards, news feeds, and charting functionalities, which is often sufficient for beginner and intermediate investors looking to deepen their research process.
Key Features & Limitations
Practical Tip: Use Koyfin's pre-built "Market Dashboard" as your morning brief to get a quick, comprehensive overview of global indices, sector performance, and key economic indicators before diving into individual stocks. While the free tier is powerful, be mindful that deeper data history and unlimited watchlists are reserved for paid subscribers.
- Website: https://www.koyfin.com/pricing/
6. StockCharts
StockCharts is a veteran in the online financial charting space, offering a robust and reliable platform primarily focused on technical analysis. It has earned its place as a dependable tool for traders who appreciate a wide variety of charting types and a straightforward, no-frills interface. While its free version has notable limitations, it provides enough functionality to serve as an excellent entry point for learning technical analysis, making it a solid choice for anyone looking for the best free stock analysis software to master charting fundamentals.
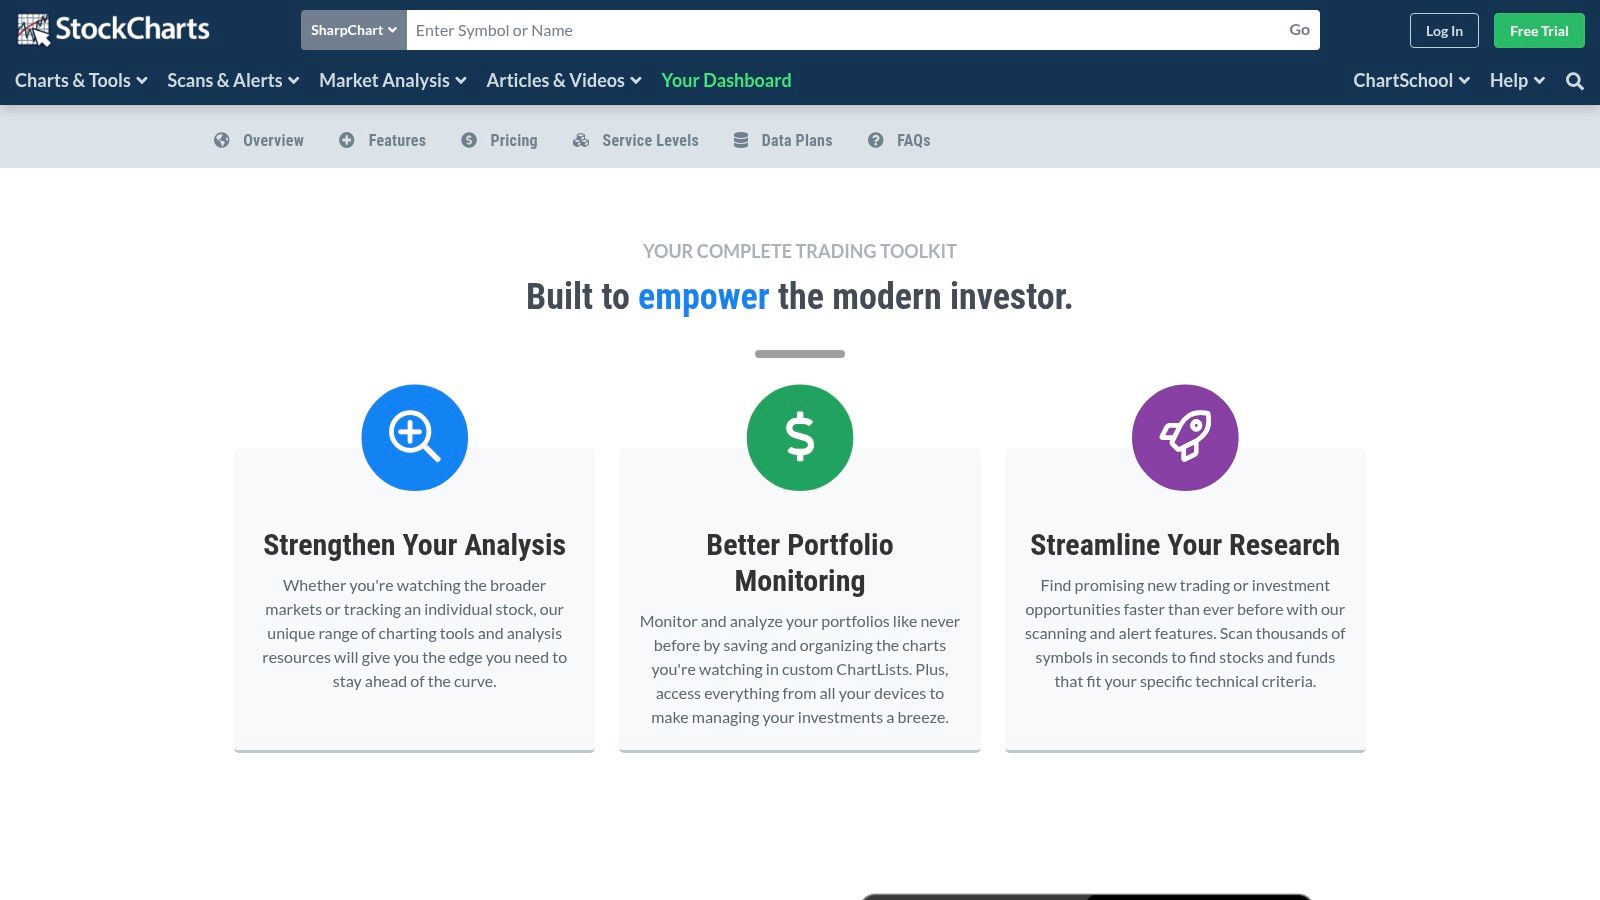
The platform's standout feature is its dedication to education. Through resources like ChartSchool and StockCharts TV, users can access a wealth of tutorials, articles, and video content to deepen their understanding of market analysis. This educational focus, combined with its specialized charting options like Point & Figure, makes it unique. The free service is browser-based and easy to access, though serious traders will quickly find the need for a paid subscription to unlock advanced tools like scans, alerts, and real-time data feeds.
Key Features & Limitations
Practical Tip: Use StockCharts' free ChartSchool resource to learn about a new technical indicator. You can then immediately apply it to a chart on the platform (within the three-indicator limit) to see how it works with real-world price action. This is a great hands-on way to build your technical analysis skills without any cost.
- Website: https://stockcharts.com/features
7. Barchart
Barchart is a comprehensive market data portal that has served investors for decades, evolving into a robust digital platform. It stands out for the sheer breadth of free information it provides, covering not just stocks but also options, futures, forex, and cryptocurrencies. For investors seeking a one-stop-shop for market data, news, and fundamental screening, Barchart offers a powerful free toolkit that rivals many paid services, earning its spot as a top contender for the best free stock analysis software.
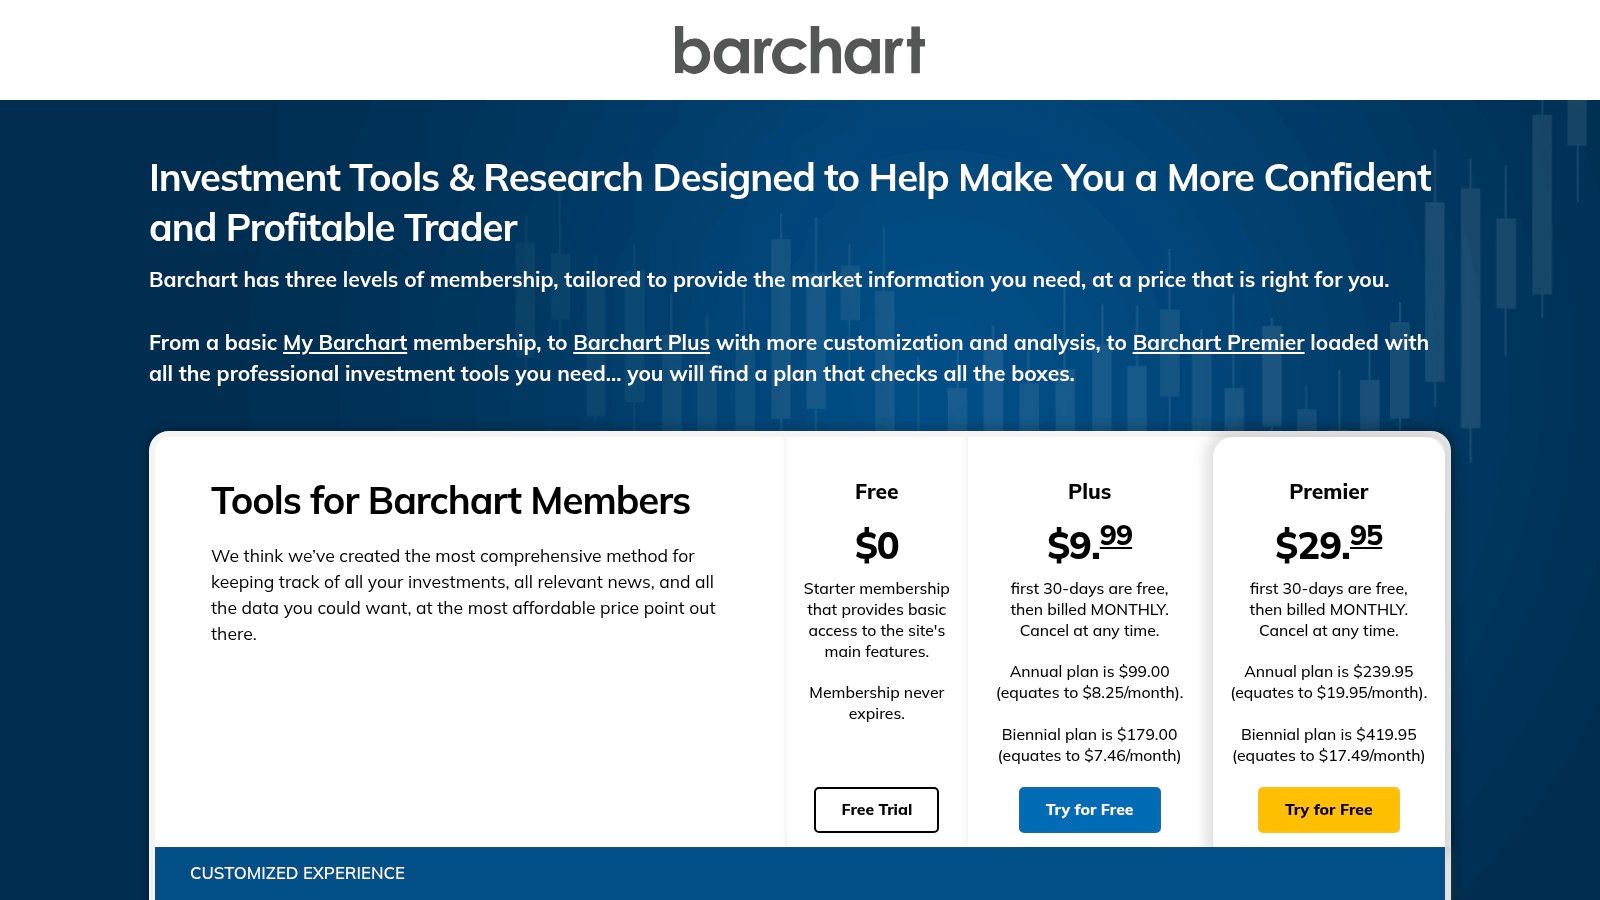
The platform excels at providing pre-built screeners and lists, such as "Top 100 Stocks" or "Unusual Options Activity," which can be a fantastic source of new investment ideas. While its user interface might feel more data-dense and less modern than some competitors, its functionality is undeniable. The free tier gives users access to interactive charting, portfolio tracking, and extensive market overviews without requiring an immediate subscription.
Key Features & Limitations
Practical Tip: Use Barchart’s "Opinions" feature, which provides a technical buy/sell/hold rating based on multiple indicators. While not a substitute for your own research, it offers a quick, aggregated technical snapshot of a stock's current momentum. Be mindful that the free version is supported by ads, which can be distracting, and advanced features like custom screeners require a Plus or Premier membership.
8. Investing.com
Investing.com is a comprehensive global financial portal that offers a surprisingly robust suite of tools for free, making it a staple for investors needing broad market data without a subscription. Its main draw is the highly versatile stock screener, which provides an extensive range of filters covering fundamental and technical data across international markets. This global reach, combined with real-time news and analysis, establishes it as one of the best free stock analysis software options for those with a worldwide investment perspective.
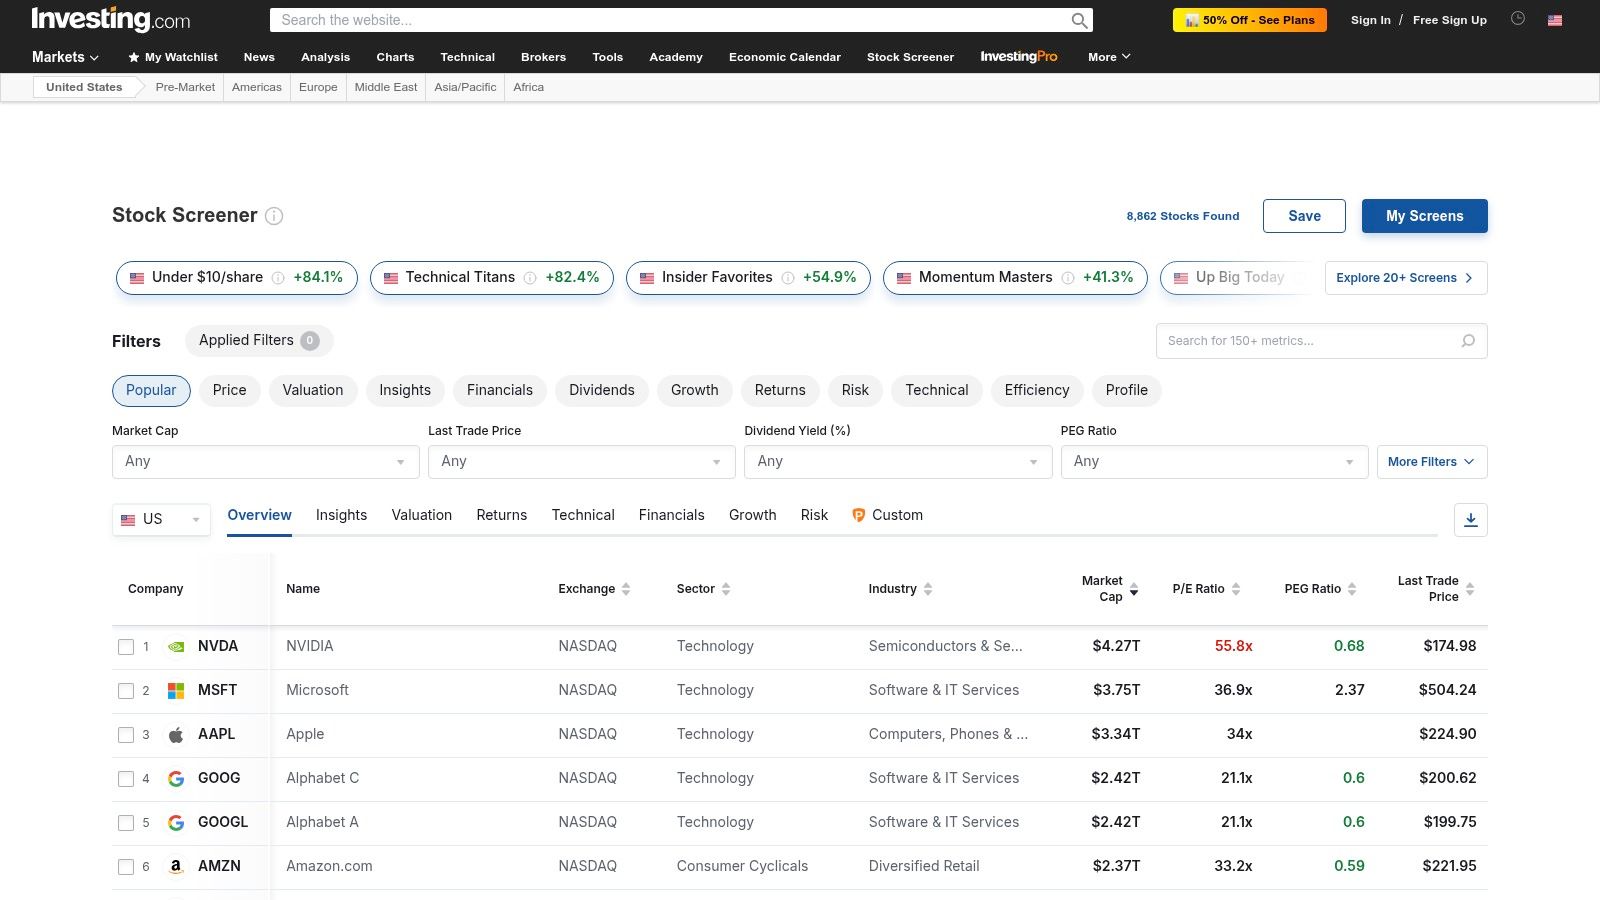
The platform effectively balances accessibility with depth, offering predefined screens like "P/E Ratio Giants" or "Strong Buy Analyst Ratings" for quick idea generation. Users can also build complex custom screens from scratch, save them, and revisit them later. While the free version is powerful, the platform heavily promotes its InvestingPro subscription, which unlocks more advanced metrics, fair value estimates, and extensive historical data, creating a clear upgrade path for serious users.
Key Features & Limitations
Practical Tip: Use the country filter in the stock screener to discover opportunities in international markets you might otherwise overlook. The predefined screens are also a great starting point; you can load one and then customize its filters to better match your specific investment criteria, saving you time.
9. Webull
Webull is a zero-commission U.S. brokerage platform that doubles as an excellent source of free stock analysis software. While primarily a trading app, its web, desktop, and mobile platforms offer a surprisingly deep suite of analytical tools at no cost, even without funding an account. This makes it a powerful contender for investors who want robust charting and screening capabilities integrated directly into a potential trading environment.
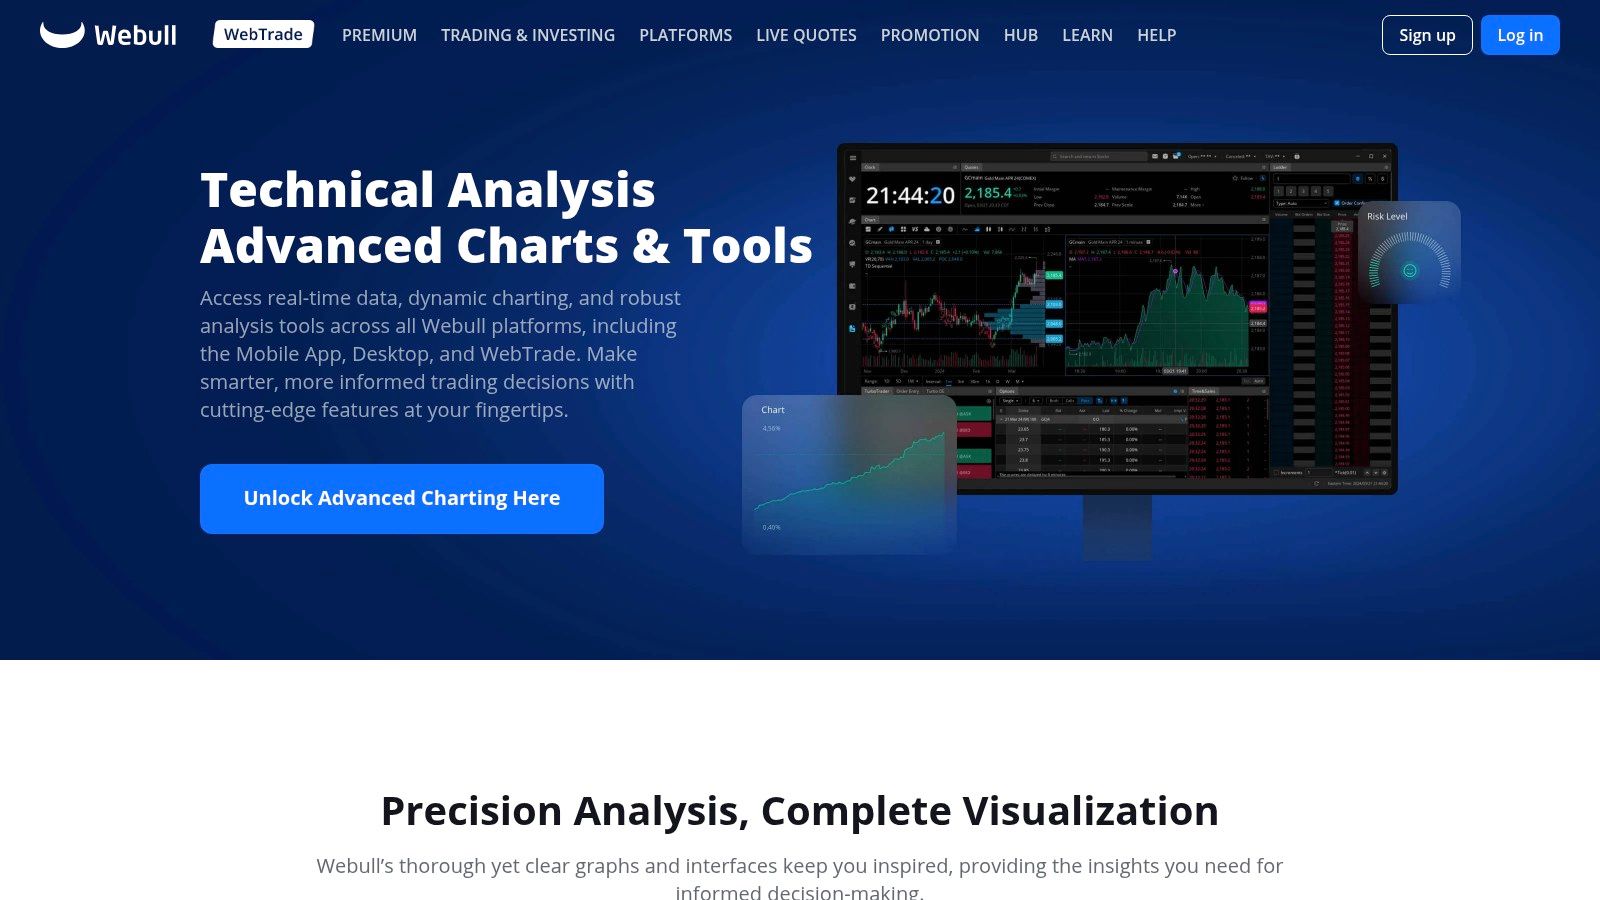
The platform stands out by offering advanced features like a paper trading simulator and detailed fundamental data pages, which are often reserved for paid services. Its clean interface provides access to over 60 technical indicators, 20+ drawing tools, earnings calendars, and analyst ratings. The community feature also allows users to share insights and discuss market trends, adding a social layer to the analysis process.
Key Features & Limitations
Practical Tip: Use Webull's paper trading feature extensively to test your analysis without risking real capital. You can apply technical indicators and fundamental research directly on the platform and then execute a simulated trade to see how your thesis plays out in a realistic market environment. While the core tools are free, be aware that advanced data feeds like Level 2 are behind a paywall.
- Website: https://www.webull.com/charts-tools
10. NinjaTrader
NinjaTrader is a professional-grade trading platform primarily recognized in the futures market, but its free simulation and backtesting tools make it an excellent resource for equity analysis and strategy development. It offers a powerful desktop application that provides free access to advanced charting, market replay, and a robust simulated trading environment. This focus on practice and strategy validation makes it a standout choice for those looking to hone their technical analysis skills before committing real capital.
The platform's strength lies in its comprehensive toolkit for technical traders. Users can build, test, and refine strategies using historical data, providing a risk-free way to understand market behavior. While its core focus is on futures, the platform's analytical capabilities are highly transferable to stock trading, especially for users who can connect it to an external equity data feed. The free version provides an impressive suite of professional tools, making it one of the best free stock analysis software options for serious strategy testing.
Key Features & Limitations
Practical Tip: Use the Market Replay feature to accelerate your learning curve. Instead of waiting for market conditions to unfold in real time, you can replay a specific trading day over and over to test how your strategy would have performed. This is an incredibly effective way to build experience and confidence. For those interested in diving deeper, you can learn more about how to backtest trading strategies to get the most out of the platform.
- Website: https://ninjatrader.com/pricing/
11. thinkorswim by Charles Schwab
Acquired by Charles Schwab, thinkorswim is a professional-grade trading suite that offers some of the most powerful analytical tools available, completely free for Schwab clients. It's less of a website and more of a full-fledged downloadable desktop platform, bringing institutional-level analysis to retail investors. Its reputation is built on its immense depth, featuring advanced charting, complex option strategy analysis, and highly sophisticated stock screeners that go far beyond basic metrics.
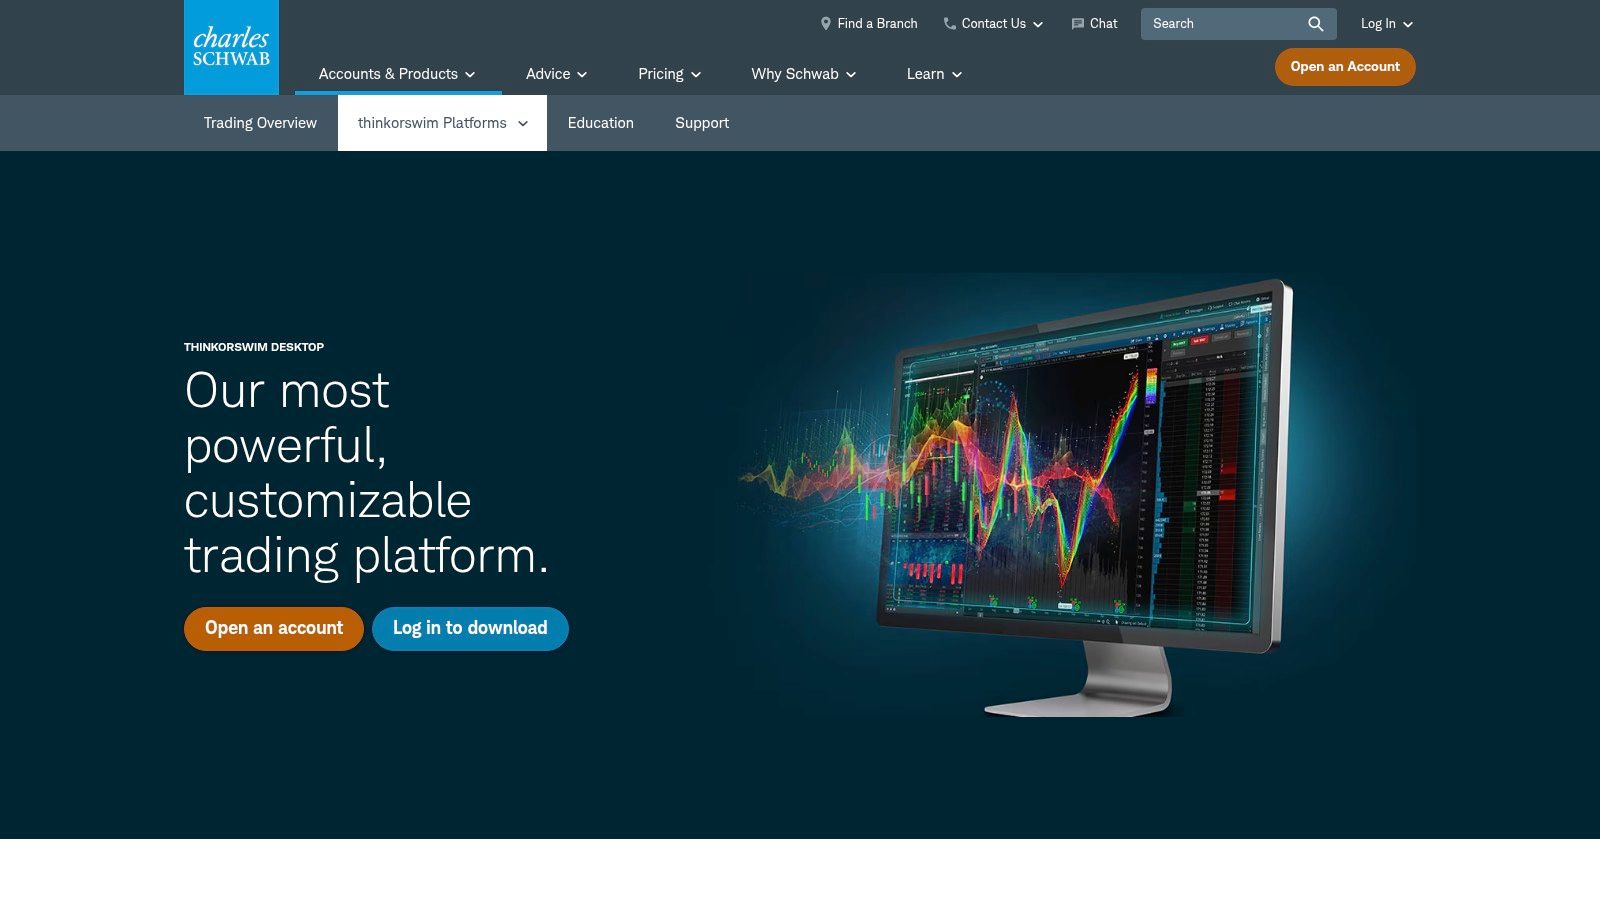
The platform truly shines with its customization capabilities through the proprietary thinkScript language, allowing users to build their own indicators and scanning criteria. Additionally, the integrated paperMoney simulator provides a risk-free environment to test strategies with real-time data. While its complexity can be intimidating for beginners, its comprehensive nature makes it an unparalleled piece of free stock analysis software for those willing to navigate the learning curve. Full access simply requires opening a Schwab brokerage account, which has no account minimums or maintenance fees.
Key Features & Limitations
Practical Tip: New users should start with the paperMoney simulator. It's a perfect replica of the live platform, allowing you to learn the extensive features and test complex trading or analysis strategies without risking any real capital. The primary "cost" is the requirement to open a Schwab account and the time investment needed to master the platform's vast toolset.
12. Fidelity Active Trader Pro (ATP)
Fidelity Active Trader Pro (ATP) is a comprehensive downloadable desktop platform that offers institutional-grade tools directly to Fidelity customers. While it requires a brokerage account, it stands out as one of the best free stock analysis software options because there are no separate platform fees or trade minimums to access its powerful features. It provides a highly customizable trading environment with real-time streaming data, advanced charting, and robust analytics designed for active traders and serious investors.
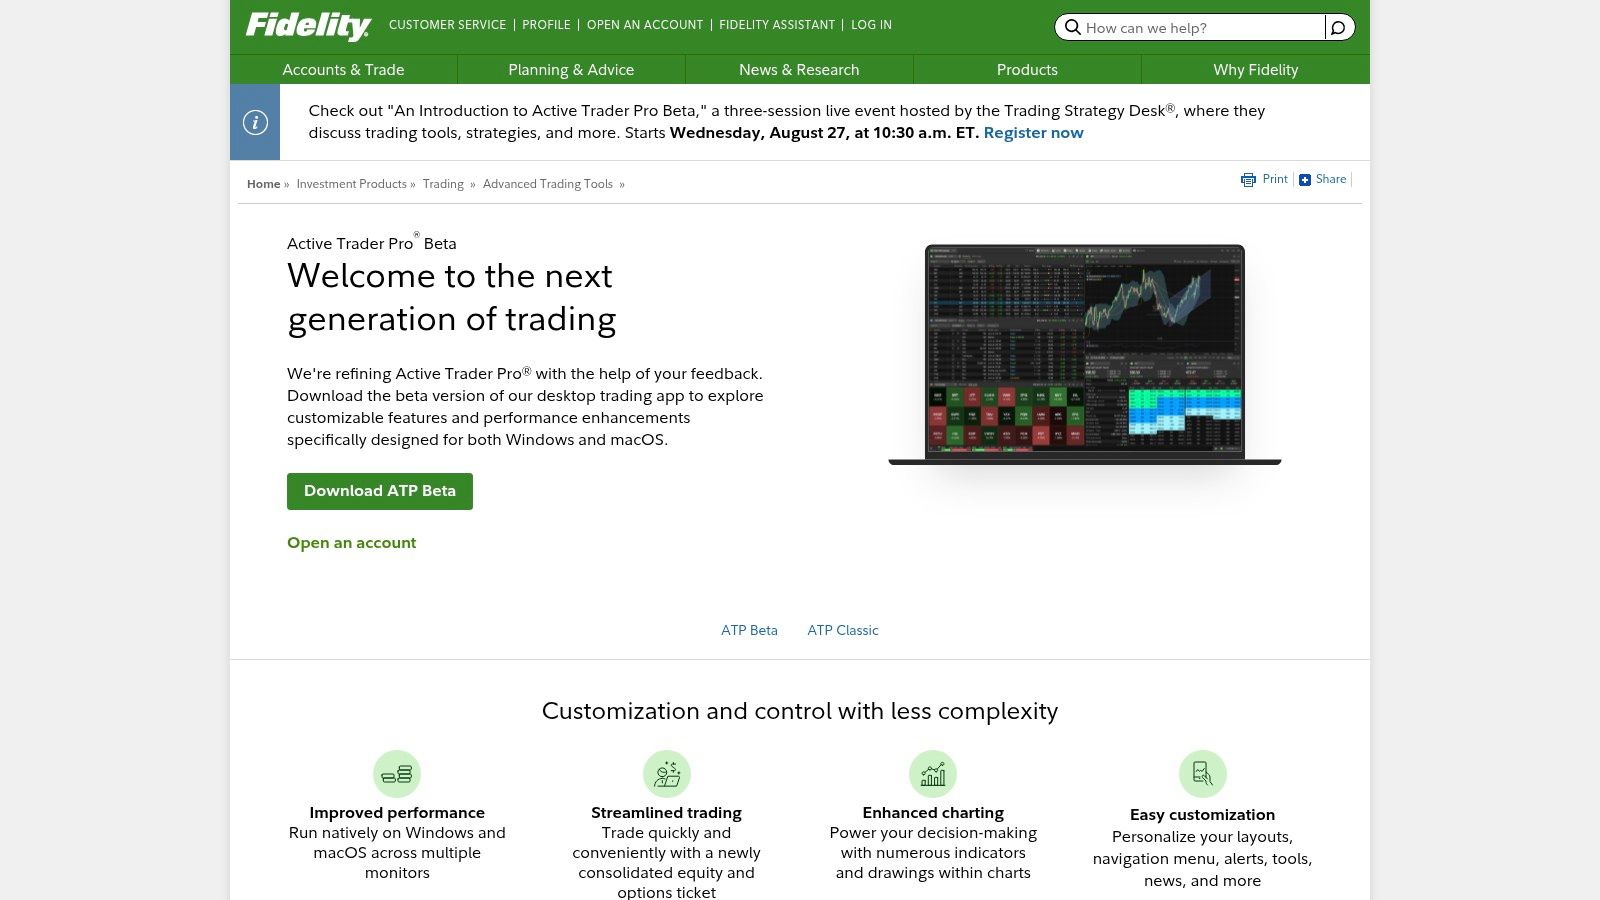
The platform integrates deep portfolio analysis, news, and research directly into its customizable layout, allowing users to build a workspace that suits their specific workflow. Its strength lies in combining sophisticated trading execution, like directed trading and hotkeys, with a solid analytical toolkit. The inclusion of extensive screening tools and a dedicated learning center makes it an excellent choice for Fidelity clients looking to elevate their analysis without incurring extra costs.
Key Features & Limitations
Practical Tip: Use the "Daily Dashboard" feature to get a snapshot of market news, economic events, and top movers before the trading day begins. This can help you quickly identify potential opportunities. While ATP is incredibly powerful, remember that it's a desktop application, so you won't have the same level of accessibility on the go as you would with a web-based platform.
Top 12 Free Stock Analysis Software Comparison
Choosing Your Edge: Making the Final Decision
Navigating the landscape of financial markets without the right tools is like trying to sail across an ocean without a compass. Throughout this guide, we've explored a dozen of the best free stock analysis software options available today, each offering a unique compass to guide your investment decisions. From the unparalleled charting capabilities of TradingView and the rapid-fire screening of Finviz to the comprehensive data portals of Yahoo Finance and Koyfin, the power accessible to the retail investor has never been greater.
We've seen how legacy platforms from brokers like Charles Schwab (thinkorswim) and Fidelity (Active Trader Pro) provide institutional-grade features deeply integrated into their trading ecosystems, perfect for their existing clients. We also examined versatile platforms like Webull and Investing.com that blend news, social sentiment, and solid technical analysis into one accessible package. Each tool has its distinct strengths, catering to different philosophies, from the day trader focused on microseconds to the long-term value investor hunting for hidden gems.
A Framework for Your Final Choice
The critical takeaway is that the ideal software is not a one-size-fits-all solution; it is a deeply personal choice that must align with your specific investment methodology, goals, and technical comfort level. To make this decision less daunting, consider your primary needs through this lens:
- For the Technical Purist: If your strategy lives and dies by chart patterns, indicators, and trend lines, your shortlist should be topped by TradingView and StockCharts. Their dedication to technical analysis is unmatched, offering endless customization and powerful visualization tools.
- For the Fundamental Screener: Investors who prioritize fundamentals, such as P/E ratios, dividend yields, and revenue growth, will find immense value in Finviz and Yahoo Finance. Their screeners are powerful, fast, and allow you to sift through thousands of stocks to find opportunities that match your strict criteria.
- For the All-in-One Brokerage User: If you value convenience and a seamless workflow between analysis and execution, sticking with your broker's platform like thinkorswim or Fidelity ATP is often the most logical choice. These tools are robust and designed to work perfectly within their native environments.
- For the Modern, Data-Driven Investor: If you need a holistic view that combines portfolio tracking, risk assessment, and forward-looking analysis, a modern platform like PinkLion is engineered for this purpose. It moves beyond simple charting and screening to provide sophisticated tools like portfolio stress-testing and scenario simulation, helping you understand not just what you own, but how your holdings might perform under various market conditions.
Actionable Next Steps: From Analysis to Action
Your journey doesn't end with reading this list. The next step is hands-on experimentation. Information overload is a real risk, so avoid the temptation to try all twelve platforms at once. Instead, select the top two or three contenders that resonated most with your investment style.
Dedicate a week to each. Link your accounts if comfortable, build a watchlist, and run your typical analysis. Ask yourself critical questions: Is the interface intuitive or cumbersome? Can I easily access the data points that matter most to me? Does this tool save me time and provide clarity, or does it add complexity? The platform that feels less like a chore and more like a natural extension of your thinking process is likely the winner. The goal is to find a tool that empowers your strategy, streamlines your workflow, and ultimately gives you the confidence to make more informed, data-backed decisions.
Ready to move beyond basic stock screening and gain a true understanding of your portfolio's risk and potential? PinkLion provides the advanced, AI-driven analytics you need, including institutional-grade stress-testing and scenario analysis, completely free. Discover your portfolio's hidden strengths and weaknesses by signing up at PinkLion today.