Investment Portfolio Performance, Explained Clearly
See what drove returns, how risk and concentration shaped outcomes, and where overlap and allocation might be distorting results - all in one dashboard.
- See Return Drivers By Holding
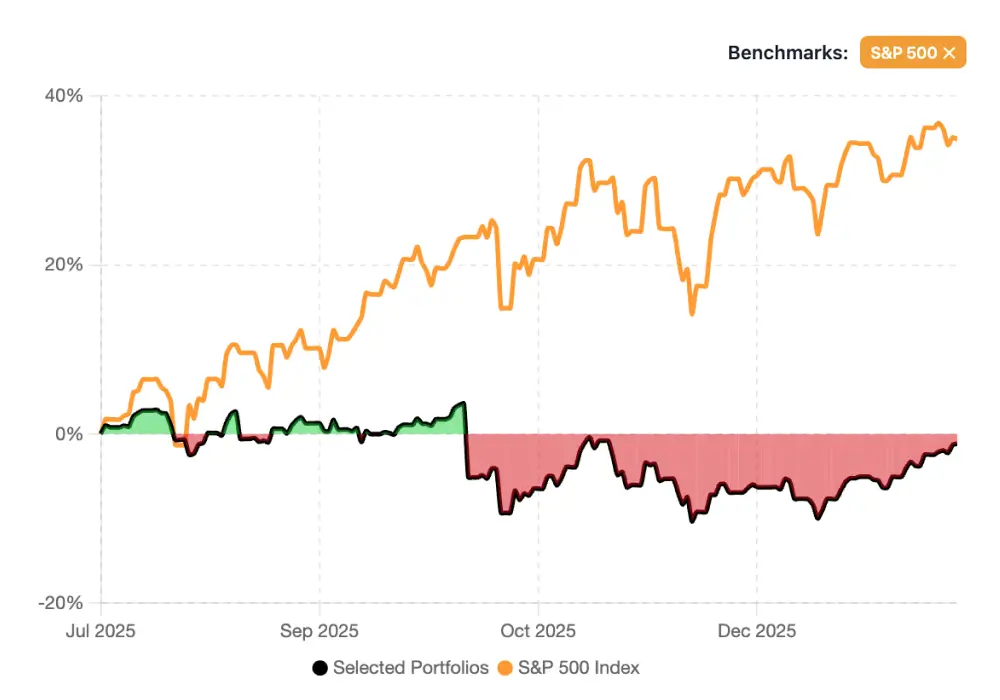
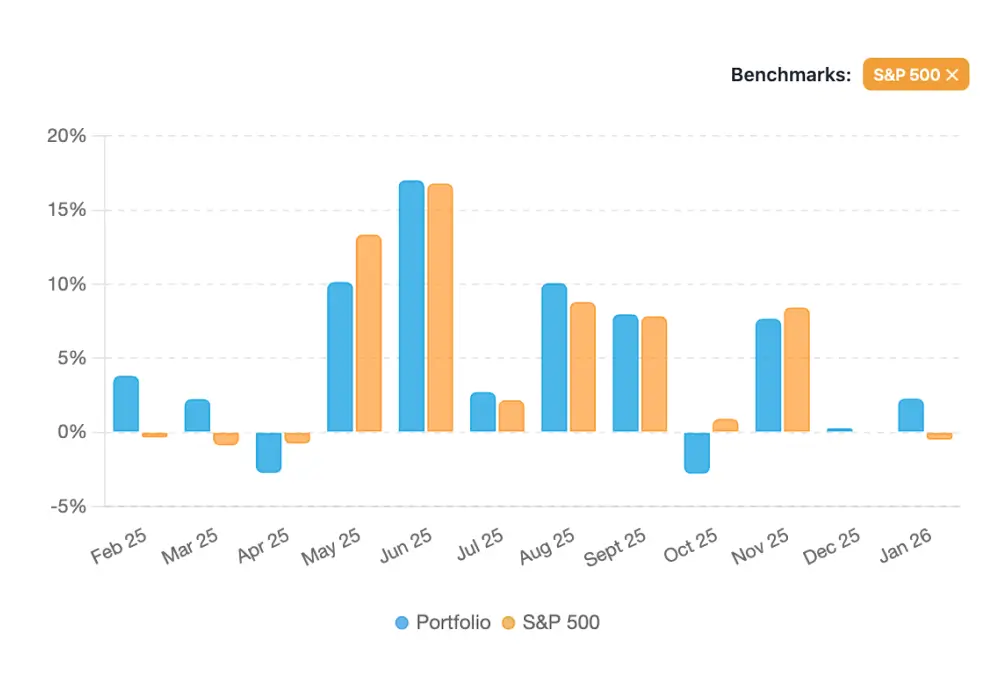
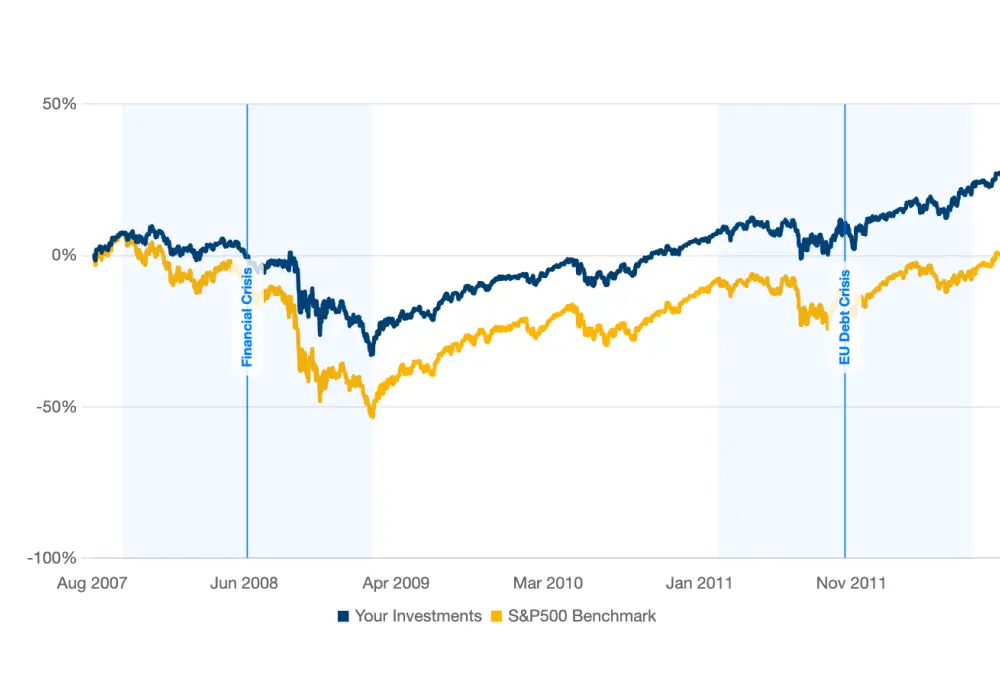
- Compare Against A Benchmark
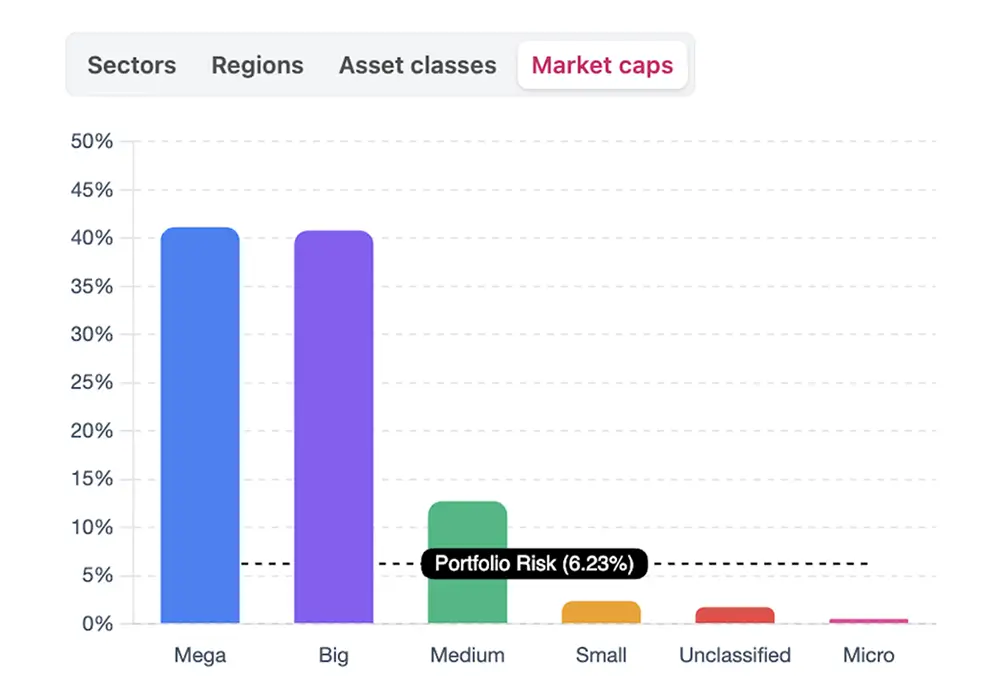
- Understand Concentration And Risk
No credit card required
Cancel anytime
GDPR and CCPA compliant