Investment Portfolio Stress Test In PinkLion
See how your current allocation behaved in past crises, compare drawdowns to benchmarks, and spot overlap and concentration before you change holdings.
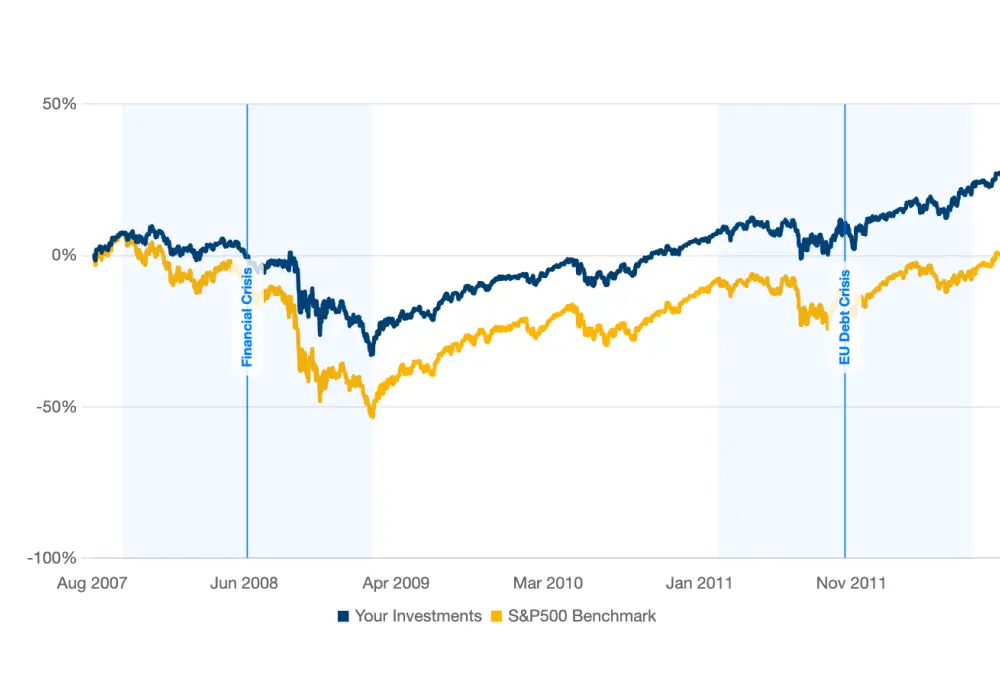
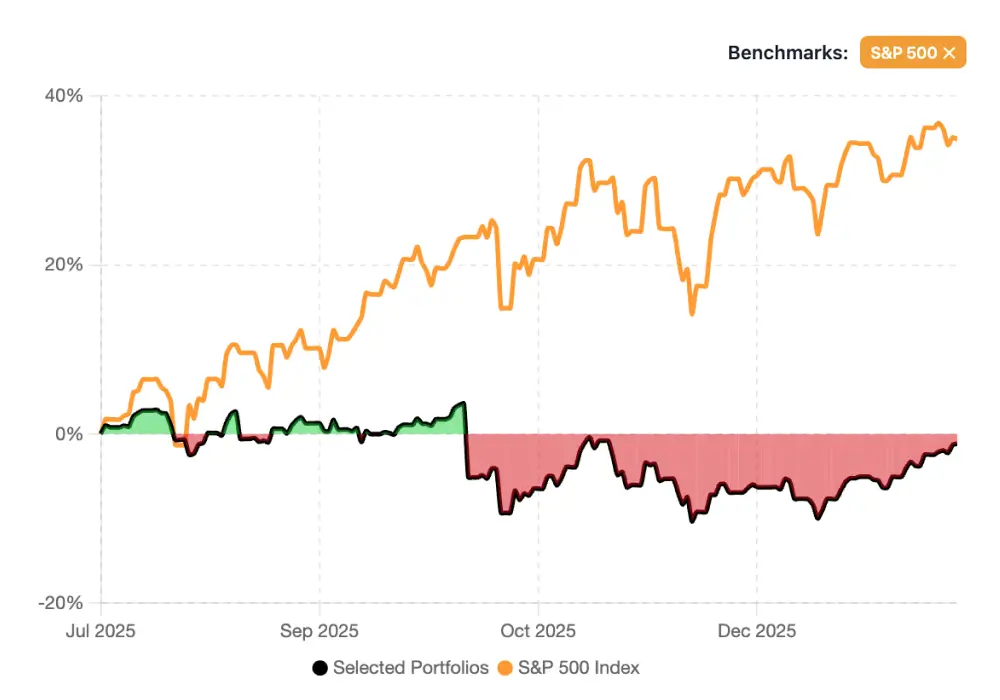
- Compare Drawdowns To Benchmarks
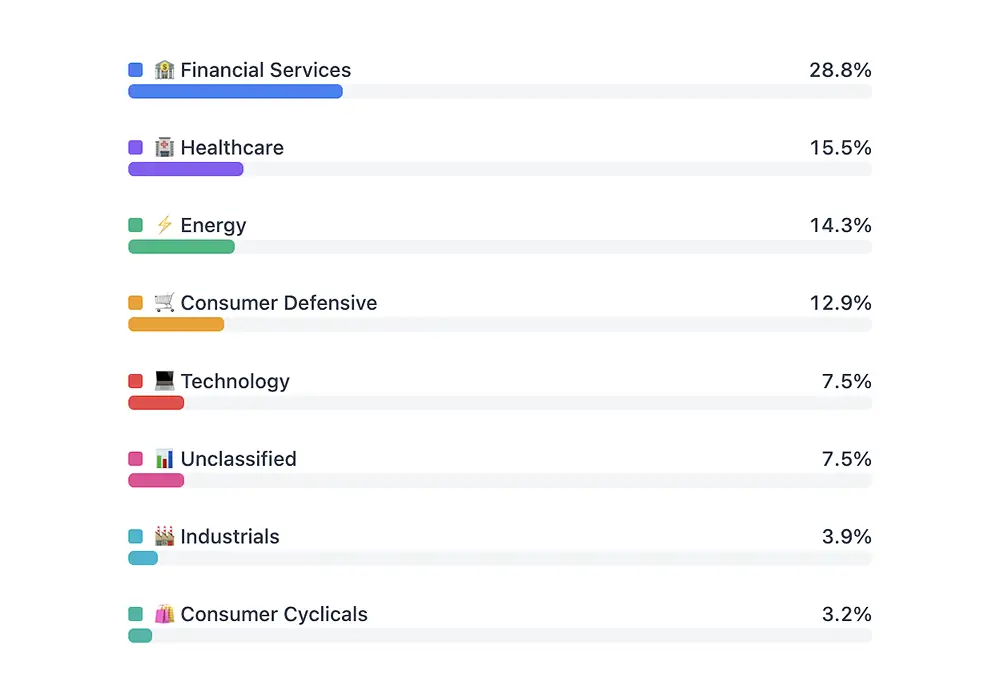
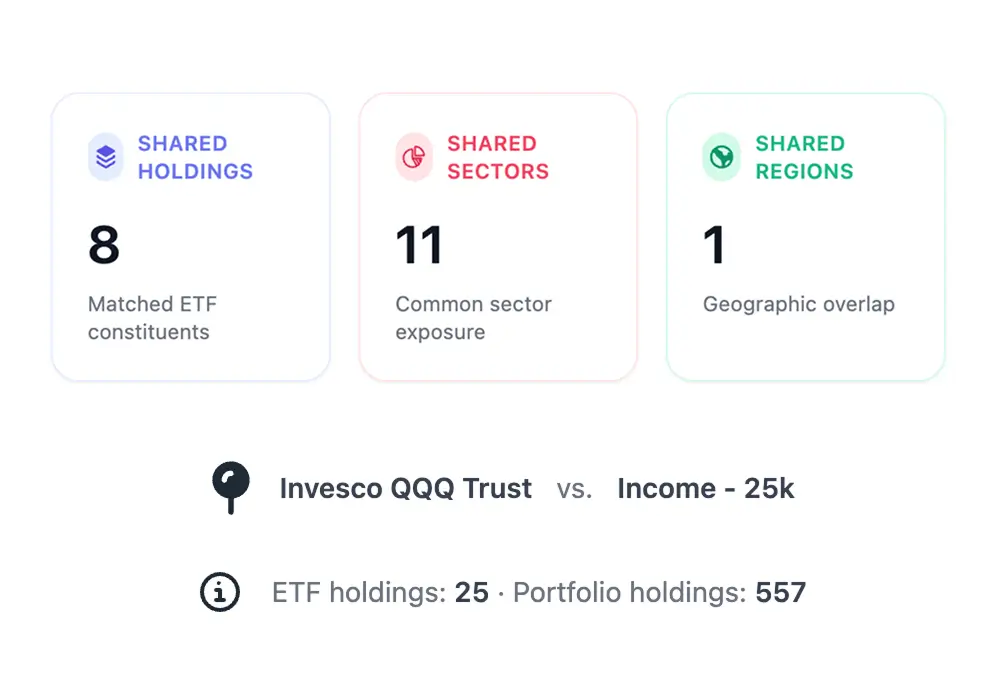
- Find Concentration You Missed
- Test Allocation Changes Fast
No credit card required
Cancel anytime
GDPR and CCPA compliant