A Morningstar ETF Overlap Tool For Your Portfolio
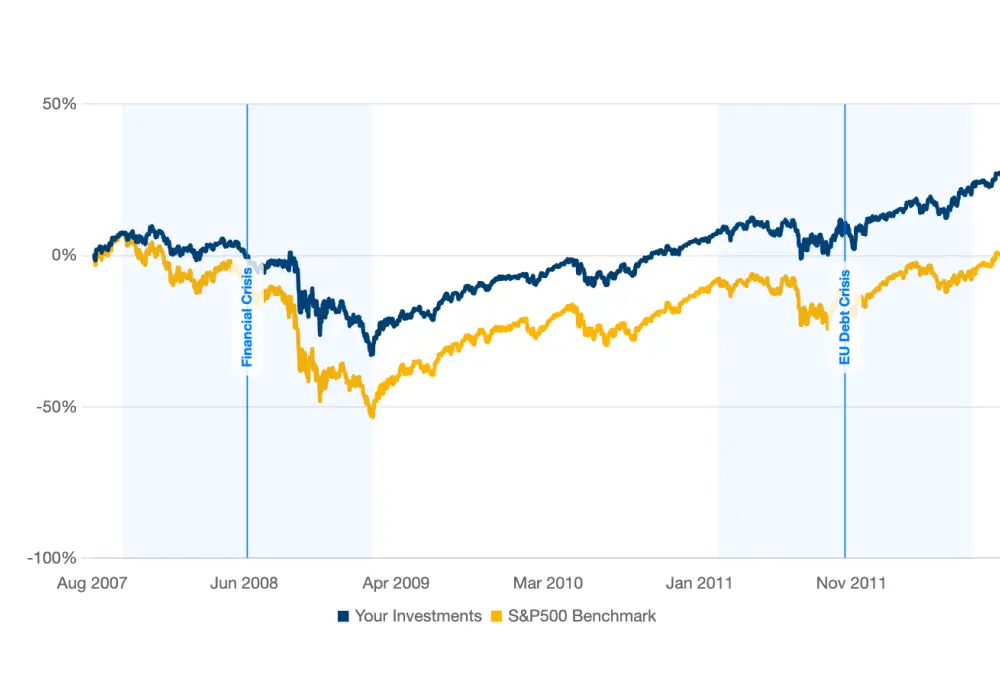
Check how much an ETF duplicates what you already own, see sector and holding concentration, and review risk context before you add it.
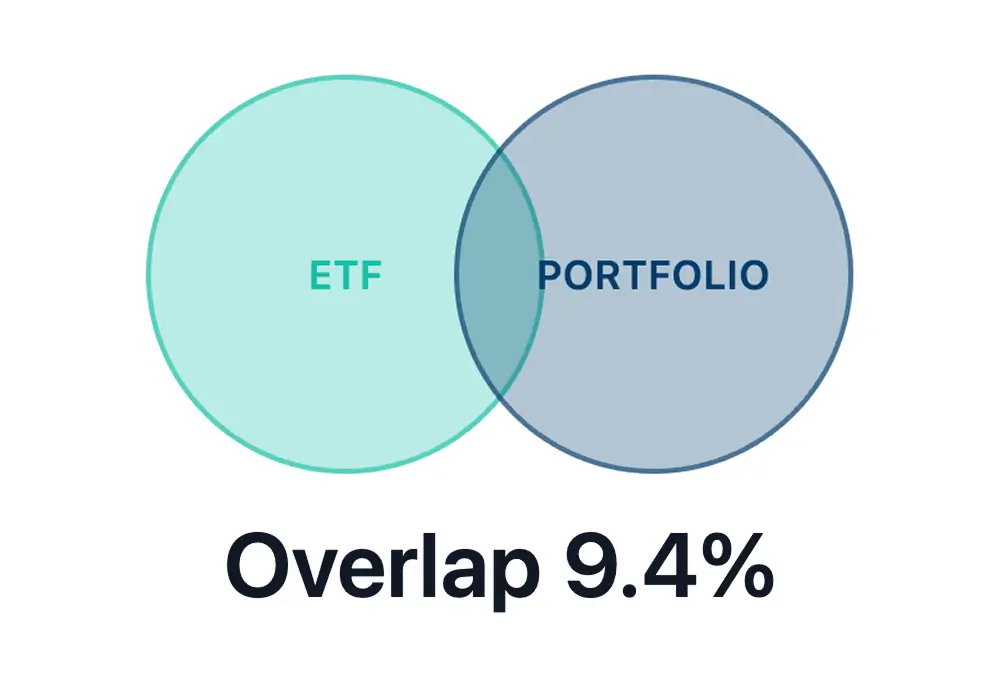
- See Overlap Before You Add An ETF
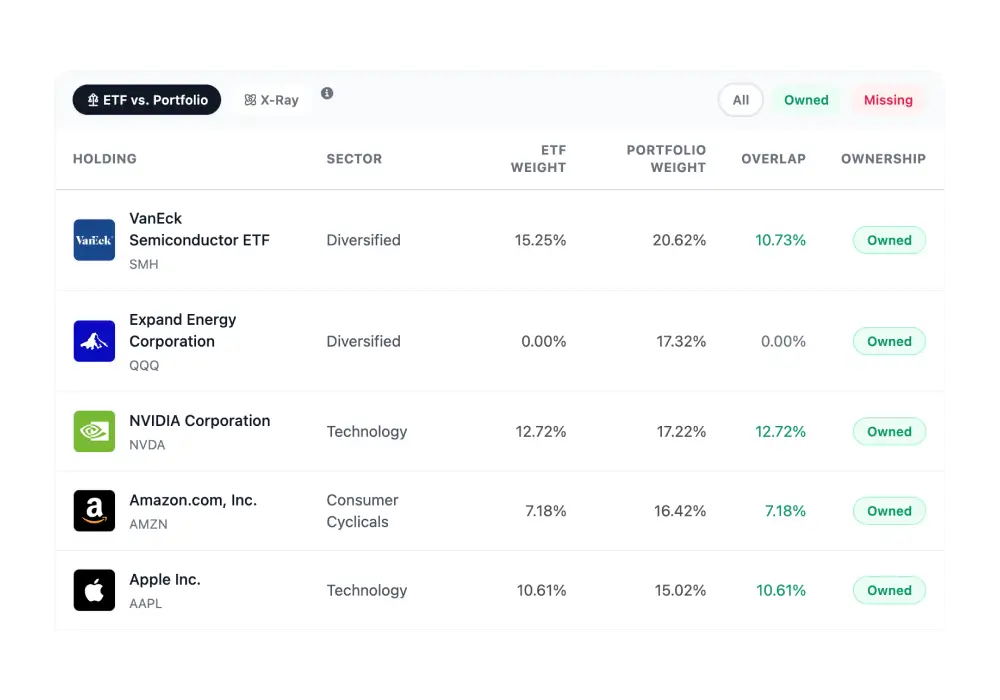
- Find Hidden Concentration In Top Holdings
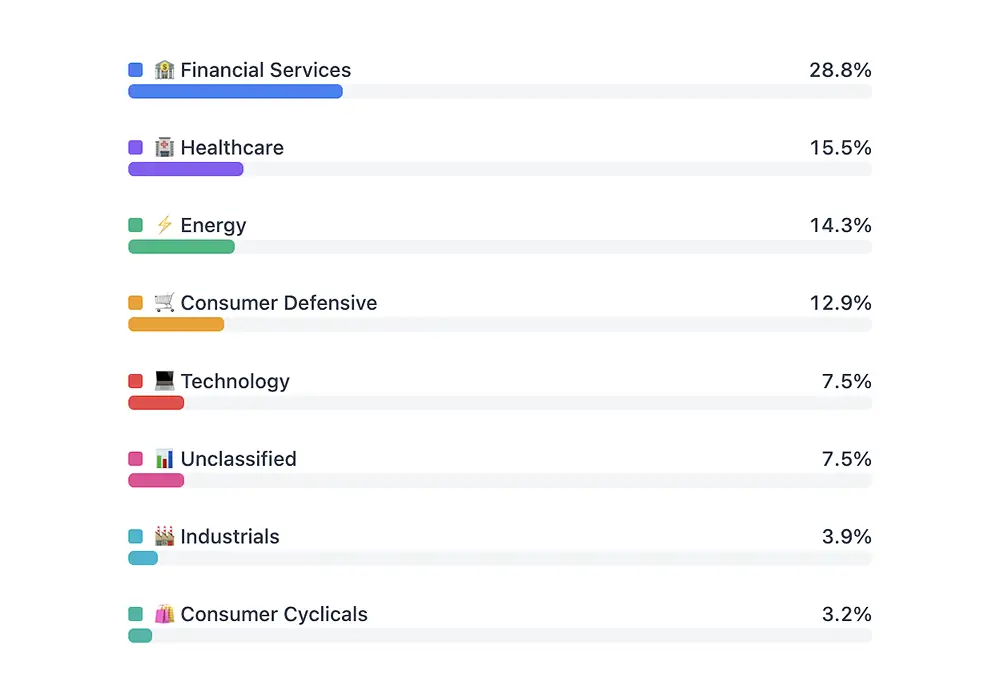
- Understand Sector And Region Tilts
No credit card required
Cancel anytime
GDPR and CCPA compliant