Mutual Fund ETF Overlap, Made Clear
See what you already own through funds and ETFs, spot hidden concentration, and compare allocation impact before you add a new position.
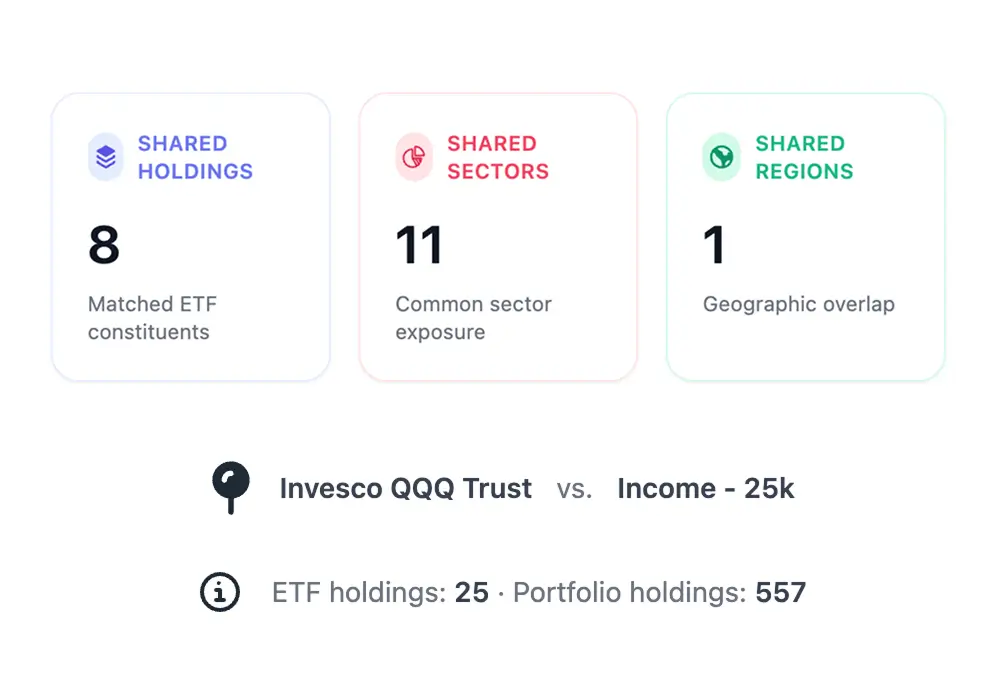
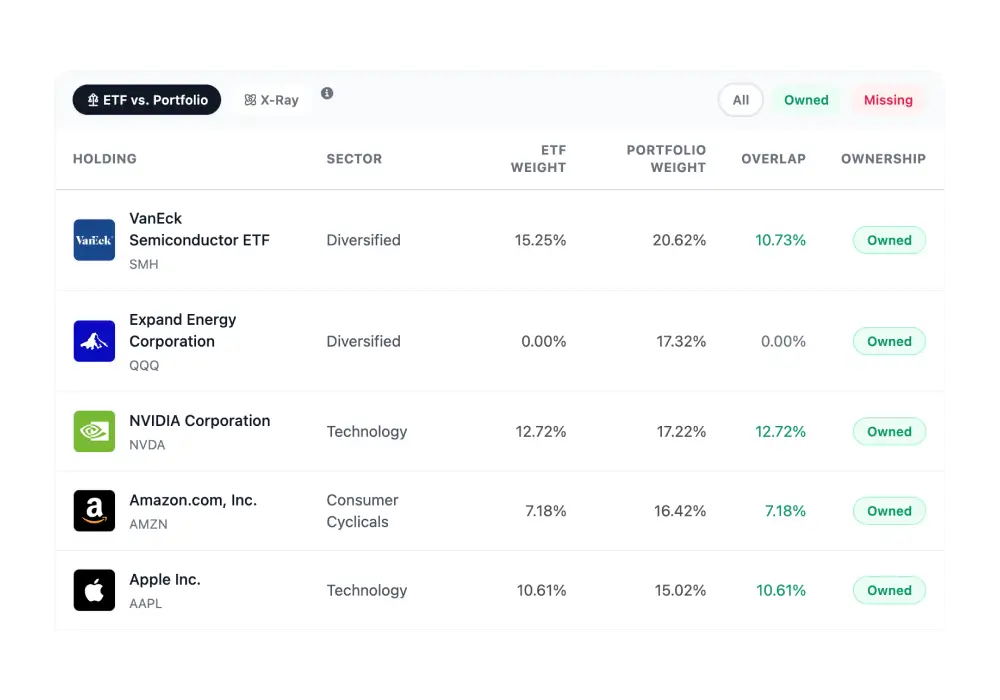
- See Overlap Before You Add
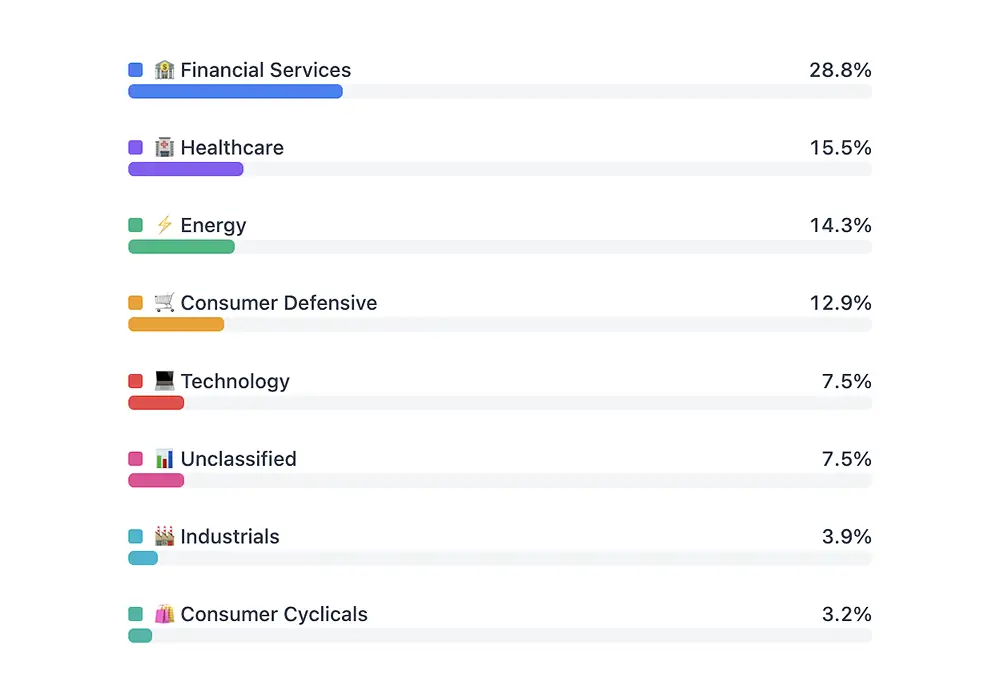
- Spot Concentration In One View
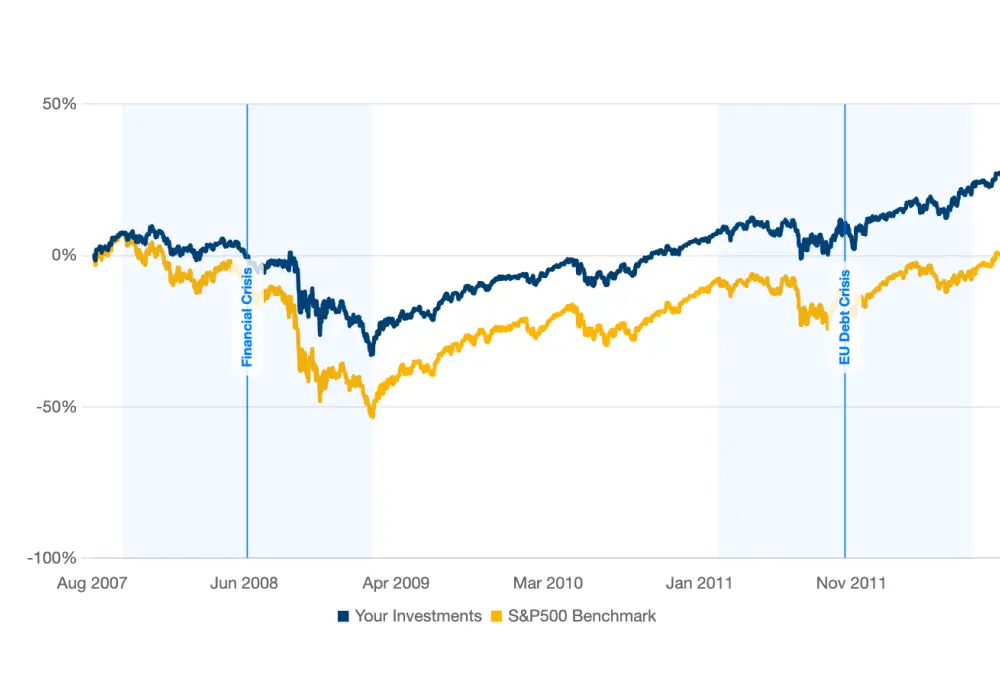
- Understand Impact On Allocation
No credit card required
Cancel anytime
GDPR and CCPA compliant