Check Mutual Fund Overlap Percentage Fast
Understand how much a fund duplicates what you already own, where concentration risk hides, and how allocations change before you invest.
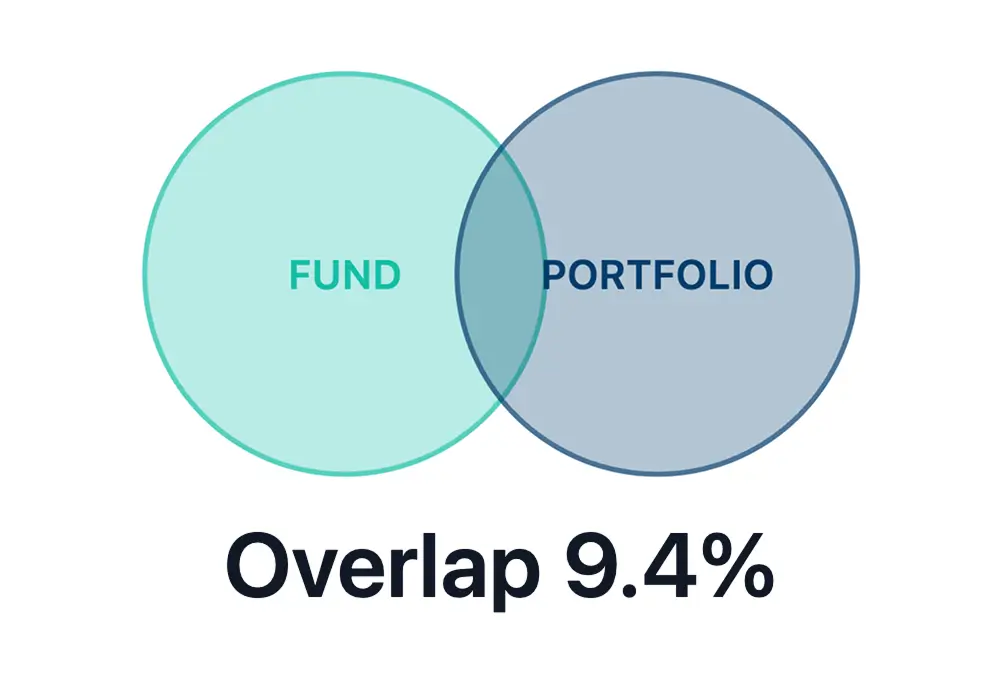
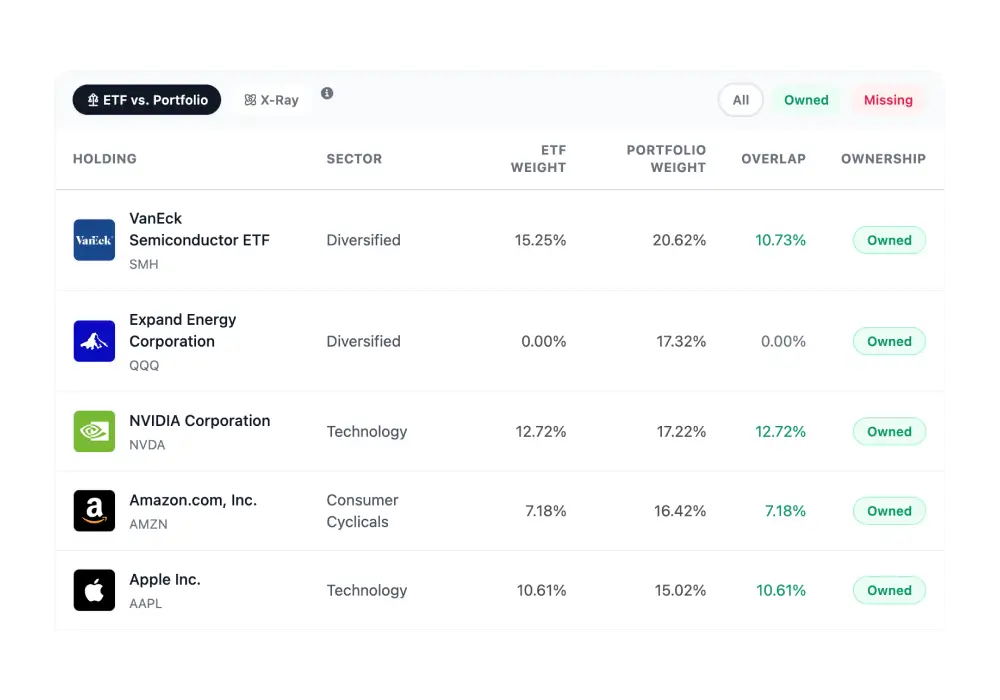
- See Overlap Before You Buy
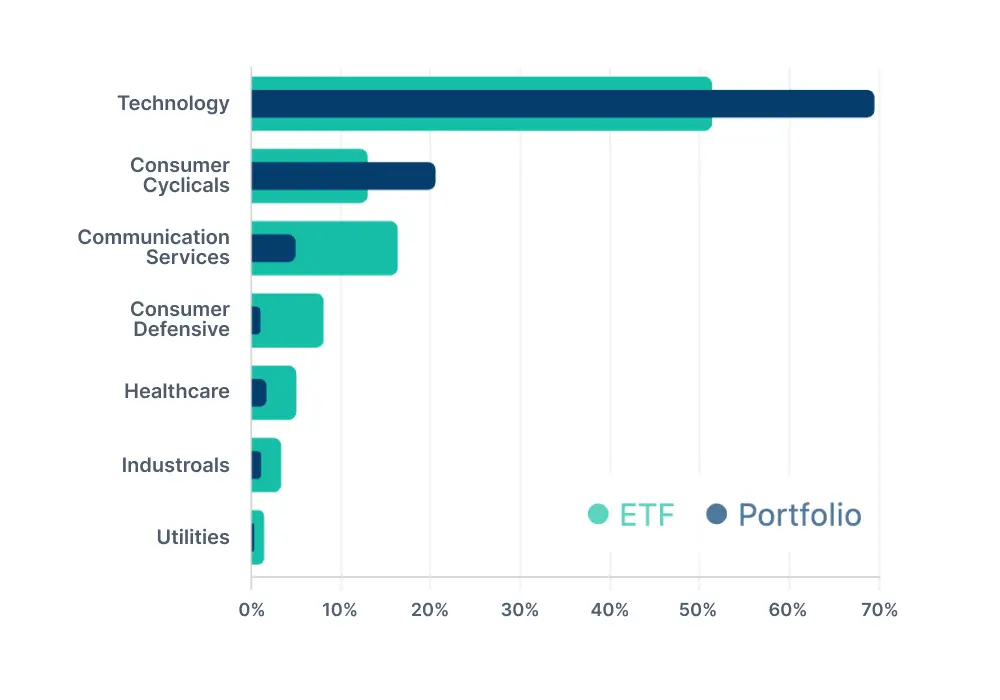
- Understand Hidden Concentration
- Verify Diversification Changes
No credit card required
Cancel anytime
GDPR and CCPA compliant