A Portfolio Tracker Tool For Clearer Decisions
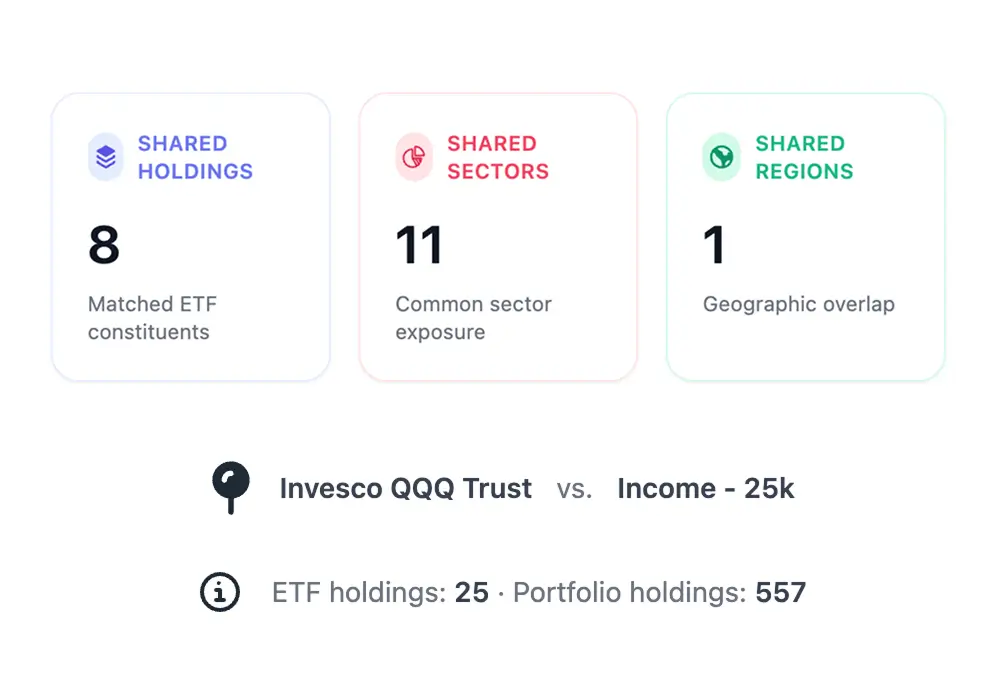
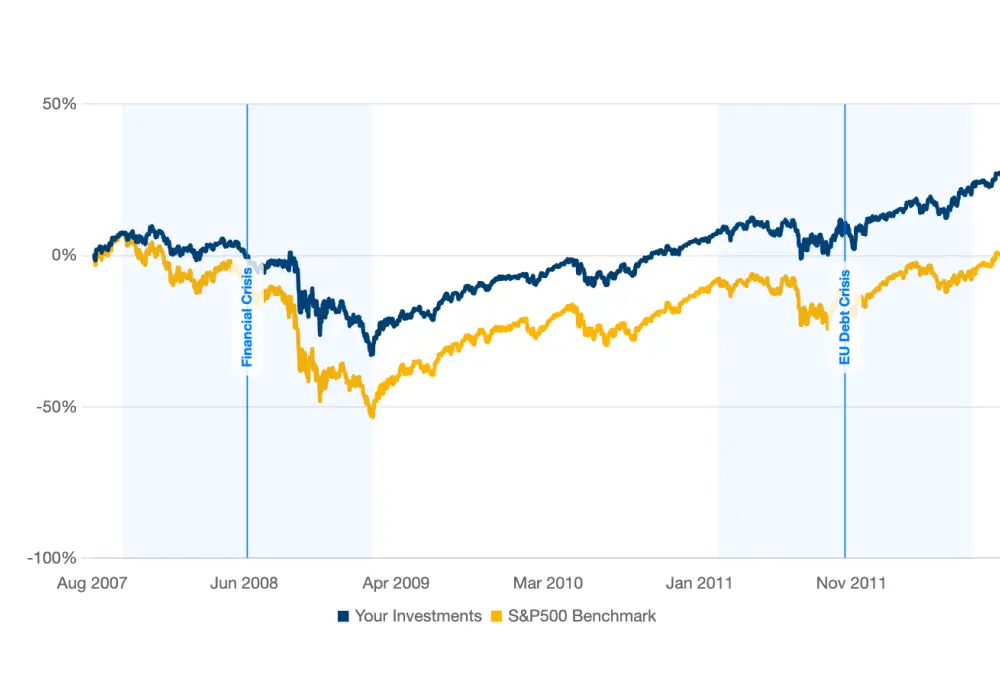
See performance, allocation, concentration risk, and ETF overlap in one place, then test what-if changes with scenarios and historical stress tests.
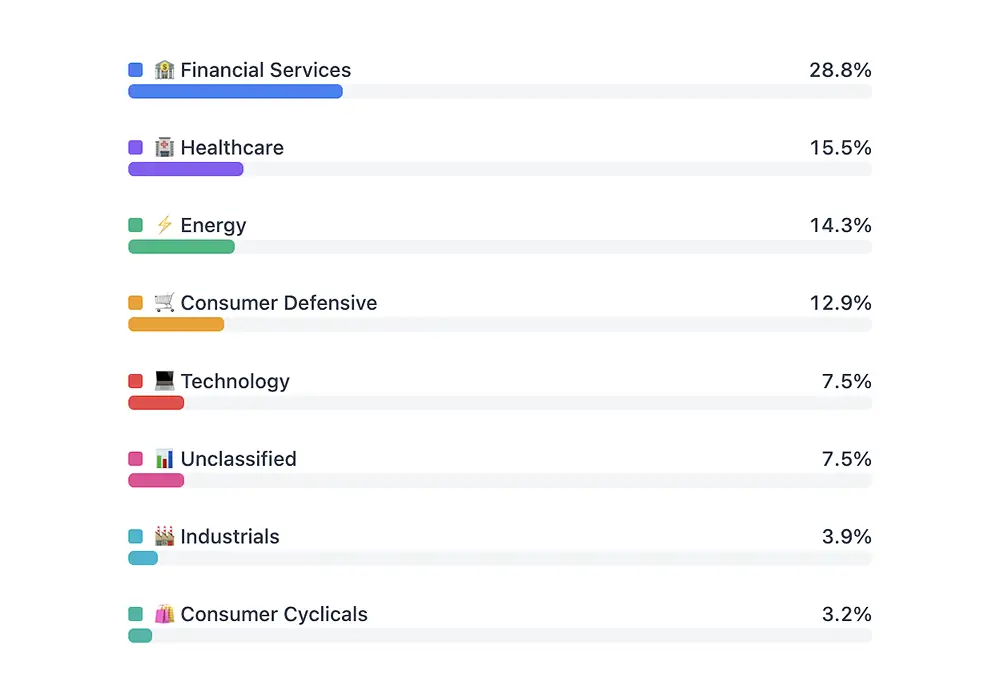
- One View Across Asset Types
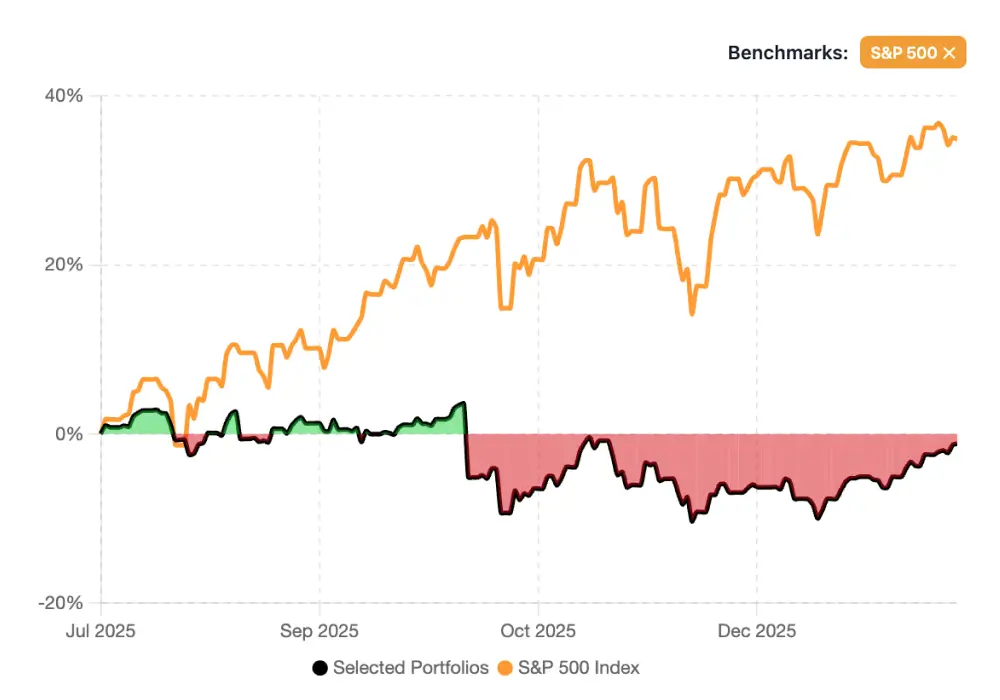
- See What Drives Returns
- Spot Concentration Risk Early
No credit card required
Cancel anytime
GDPR and CCPA compliant