Research Report
Most Duplicated Stocks Across the Top 100 U.S. ETFs
What diversification looks like once you open the hood.
What diversification looks like once you open the hood.
To measure concentration beneath the ETF wrappers, we ranked every reported holding across the Top 100 U.S. listed ETFs by Assets Under Management (AUM) weighted exposure, defined as ETF AUM times holding weight. We then plotted the cumulative share of total mapped exposure captured as you move from the largest underlying position to the smallest. This isolates a simple question: When investors spread assets across many ETFs, how quickly do those dollars still funnel into the same underlying names?
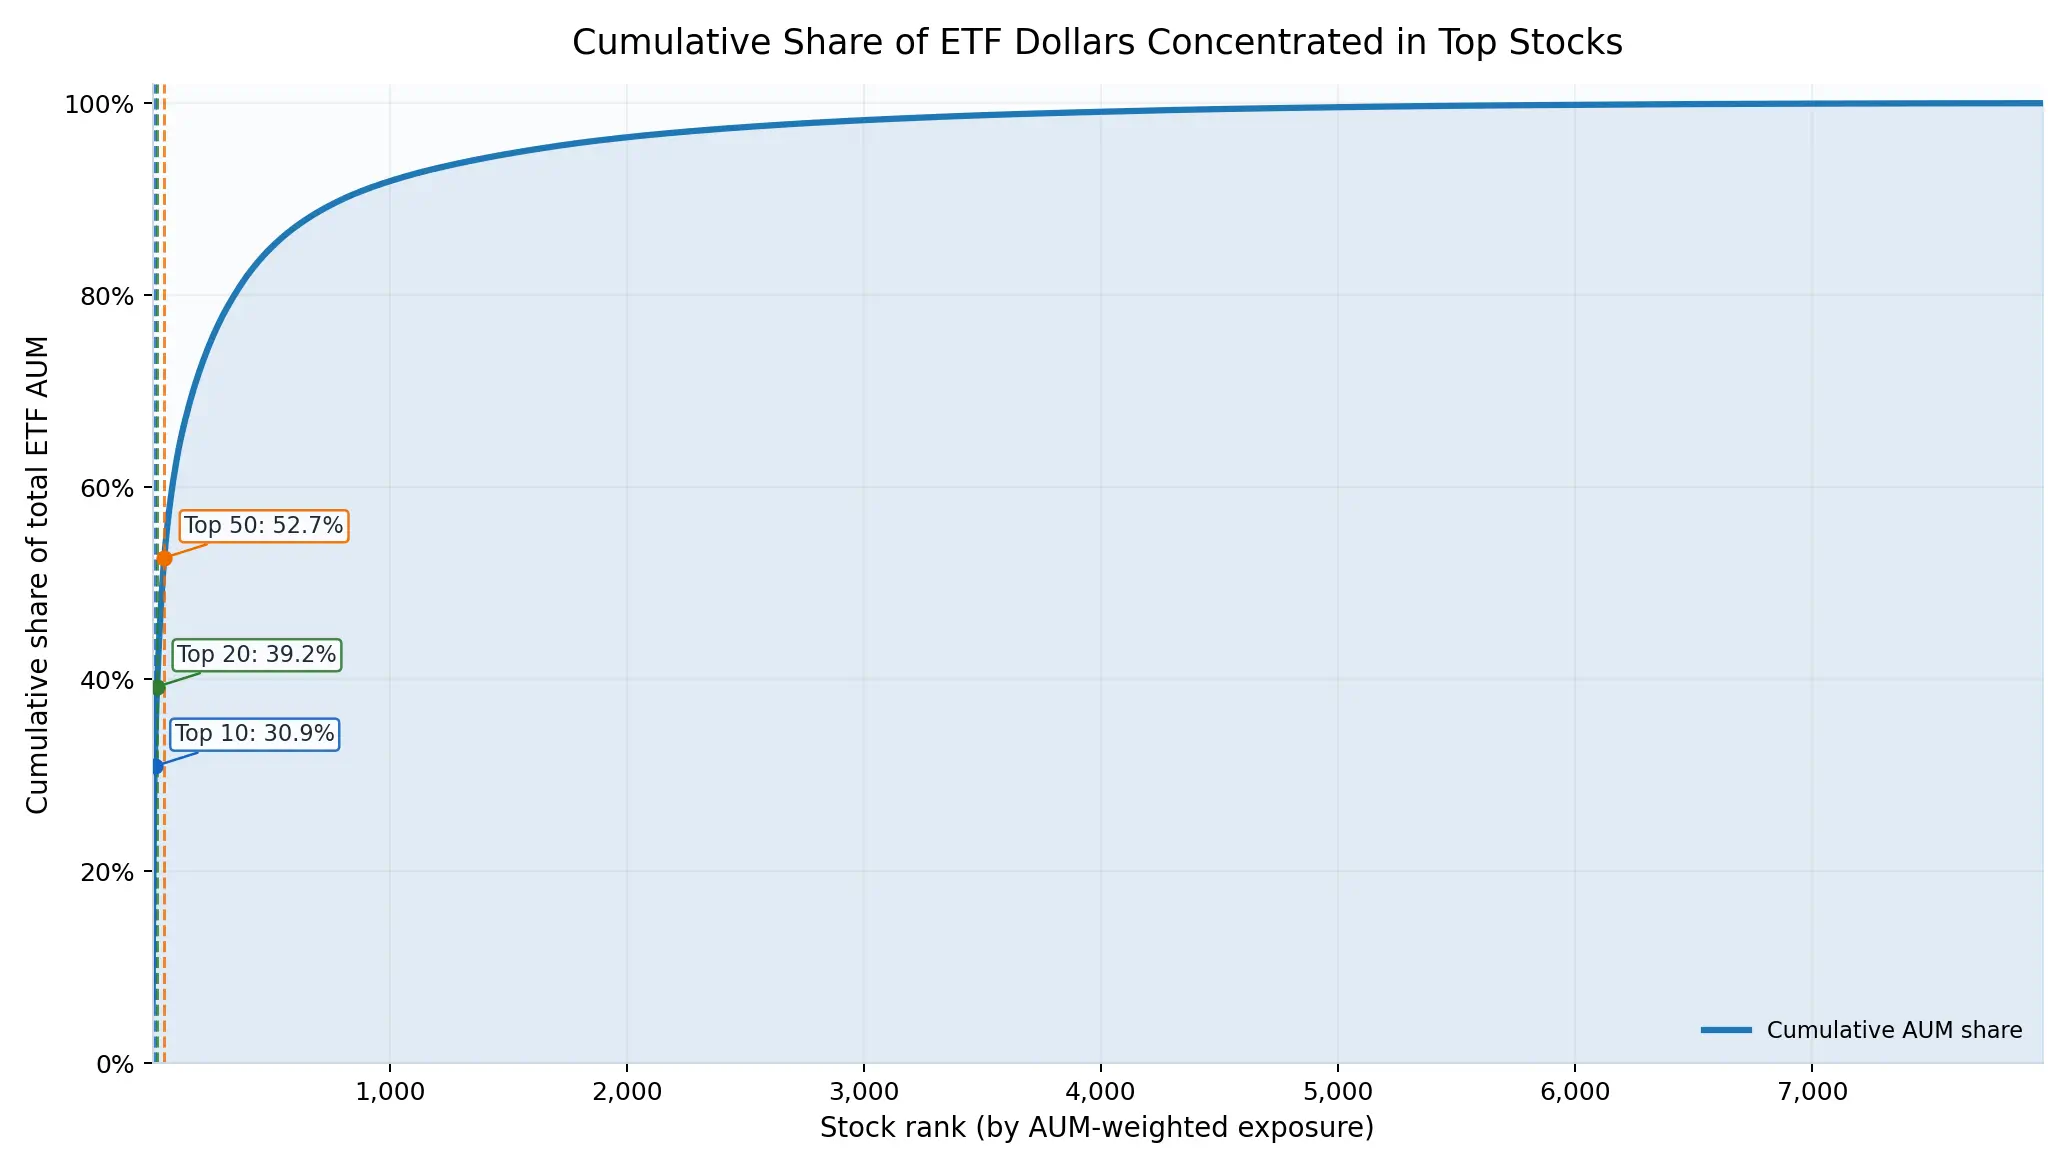
The concentration curve is steep. The top 10 underlying holdings account for 30.9% of mapped exposure. The top 20 reach 39.2%, and the top 50 reach 52.7%. Put plainly, even across 100 ETFs, more than half of the measured exposure clusters into a relatively small set of holdings.
Concentration is visible even at the very top of the ranking. The single largest underlying position represents 6.4% of mapped exposure on its own, and the top three positions together reach about 16.7%. This is the mechanism behind the diversification mirage. Portfolios with multiple large ETFs can still behave like portfolios with fewer effective bets, because the same holdings dominate the dollars.
The holdings driving the early rise of the curve are the familiar mega cap complex, for example NVIDIA, Apple, Microsoft, Amazon, Broadcom, Alphabet, Meta, and Tesla. These names recur across core index ETFs, growth ETFs, and sector funds, concentrating investor capital into a shared set of exposures and increasing the likelihood of co movement across seemingly different ETF portfolios.
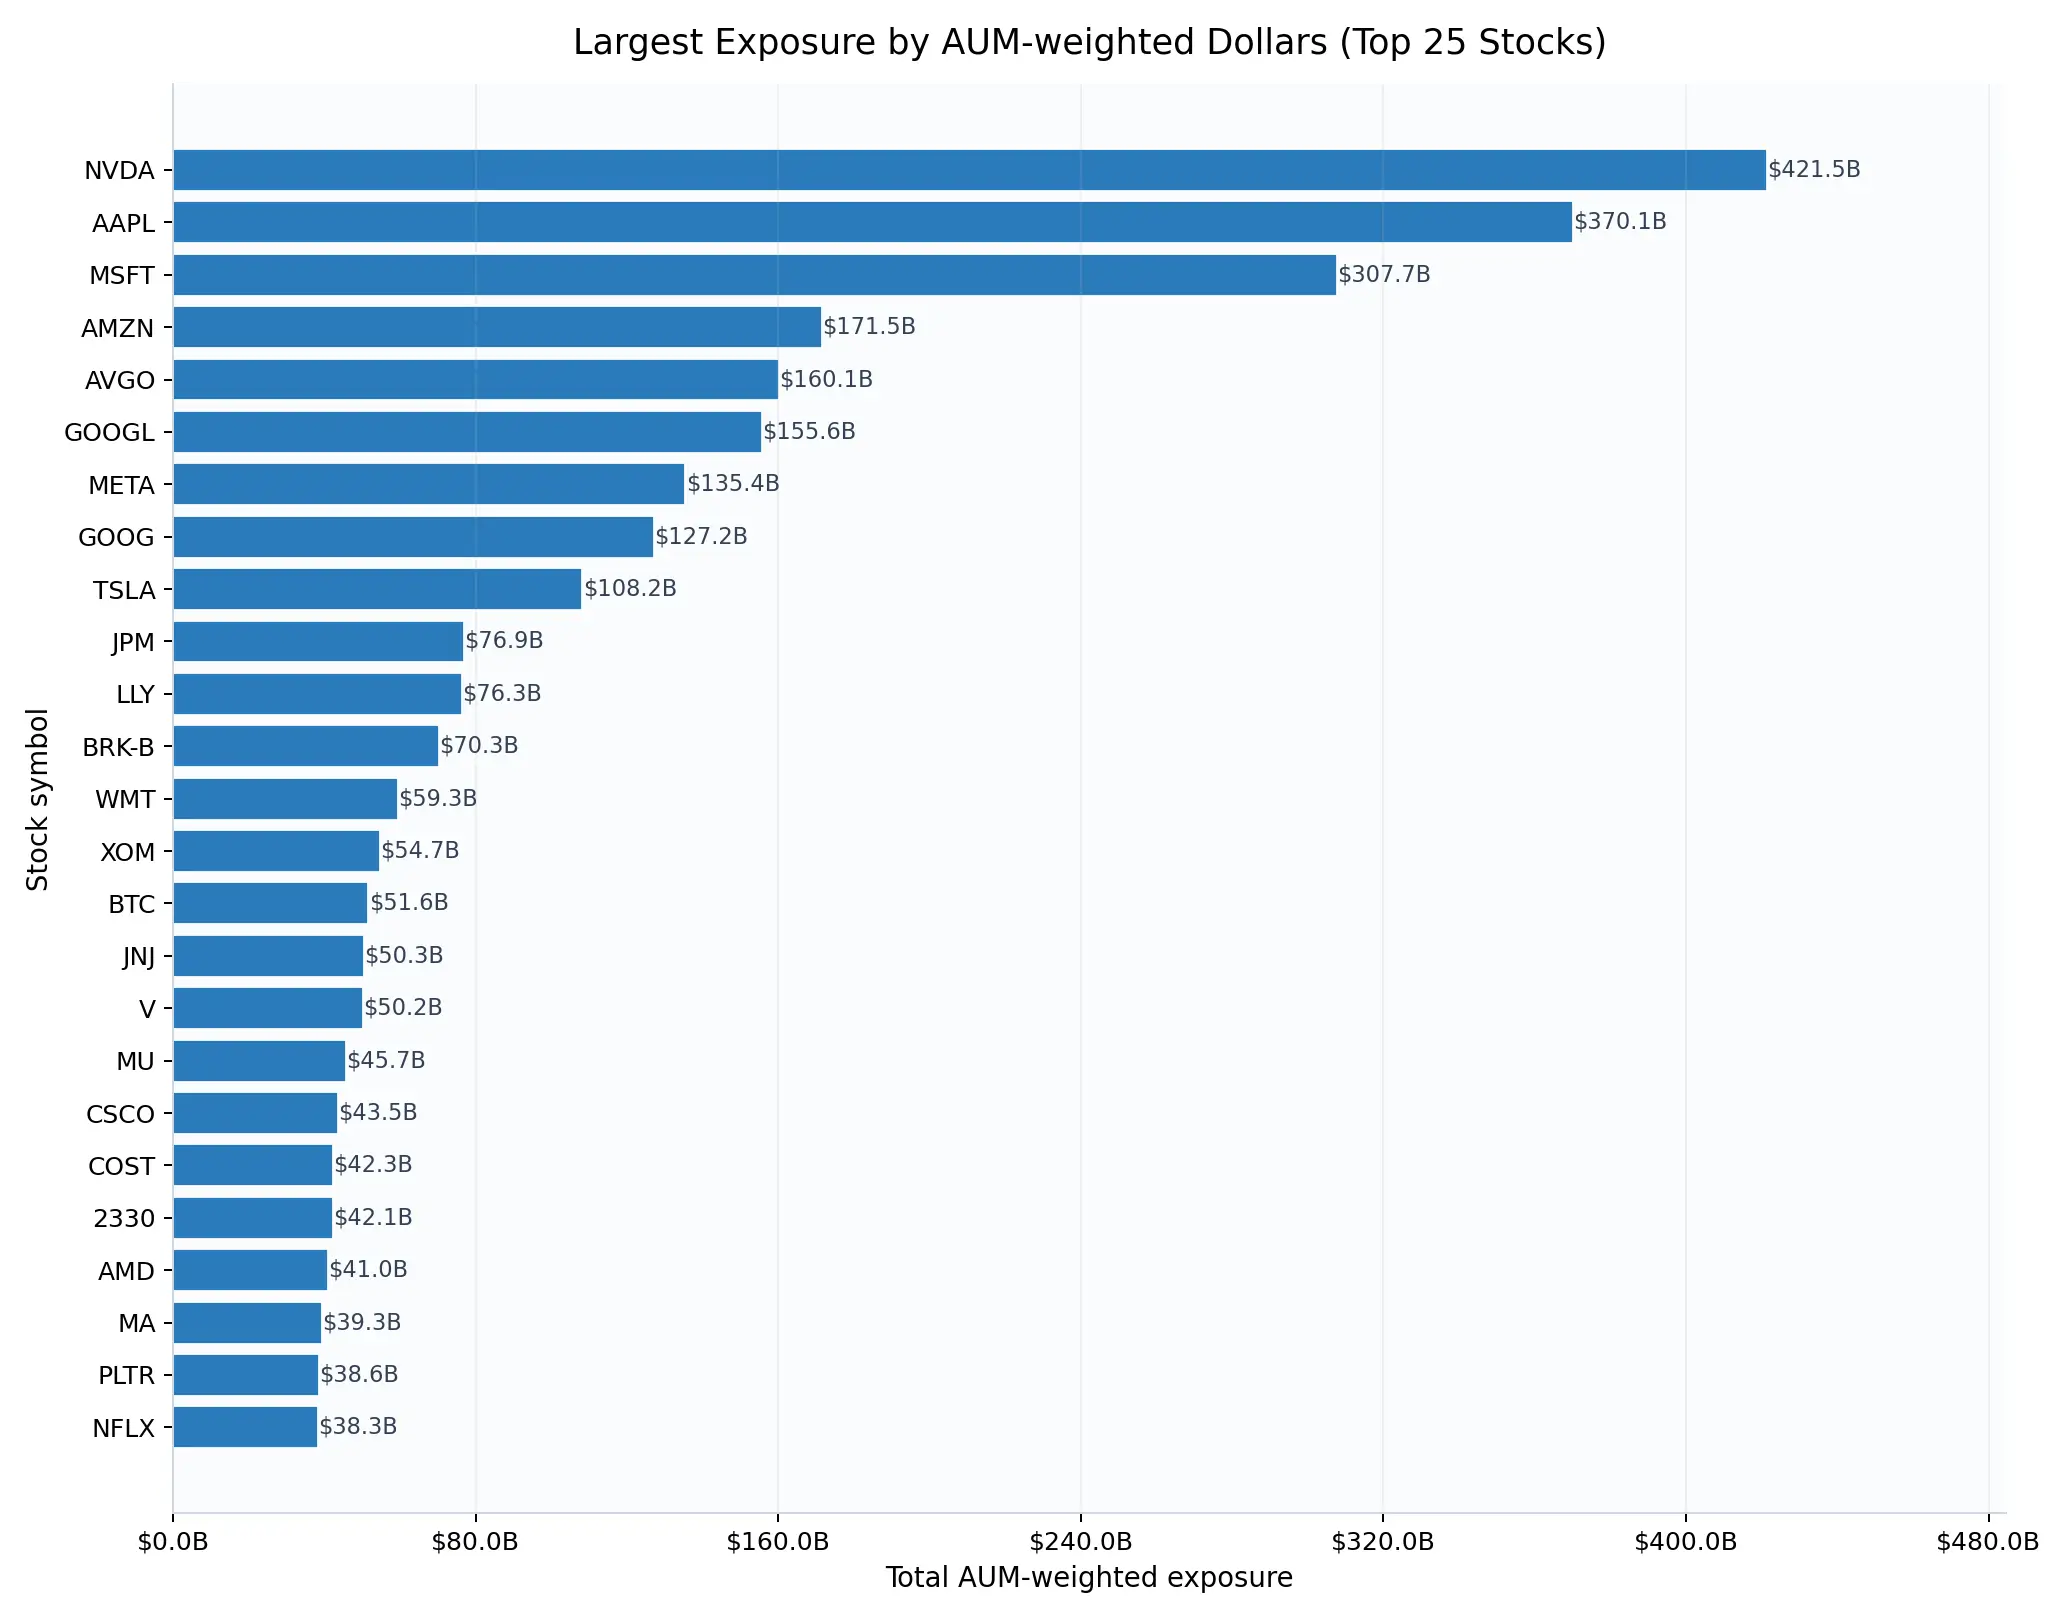
Counting how many ETFs hold a stock tells you what is common. To understand concentration risk, we also need to know where the dollars are. For each ETF, we estimated dollar exposure as ETF AUM times holding weight, then summed those exposures across the Top 100 U.S. listed ETFs. This produces a single, comparable figure for each holding, which is how much of the mapped Top 100 ETF exposure is effectively allocated to it.
| Stock | AUM-Weighted Exposure | % of Mapped Exposure | # ETFs | Sector | Top ETF |
|---|---|---|---|---|---|
| NVIDIA Corporation (NVDA) | $421.5B | 6.41% | 37 | Technology | VOO |
| Apple Inc (AAPL) | $370.1B | 5.63% | 40 | Technology | VOO |
| Microsoft Corporation (MSFT) | $307.7B | 4.68% | 38 | Technology | VOO |
| Amazon.com Inc (AMZN) | $171.5B | 2.61% | 36 | Consumer Cyclical | VOO |
| Broadcom Inc (AVGO) | $160.1B | 2.44% | 38 | Technology | VOO |
| Alphabet Inc Class A (GOOGL) | $155.6B | 2.37% | 34 | Communication Services | VOO |
| Meta Platforms Inc. (META) | $135.4B | 2.06% | 31 | Communication Services | VOO |
| Alphabet Inc Class C (GOOG) | $127.2B | 1.93% | 30 | Communication Services | VOO |
| Tesla Inc (TSLA) | $108.2B | 1.65% | 28 | Consumer Cyclical | VOO |
| JPMorgan Chase & Co (JPM) | $76.9B | 1.17% | 31 | Financial Services | VOO |
| Eli Lilly and Company (LLY) | $76.3B | 1.16% | 31 | Healthcare | VOO |
| Berkshire Hathaway Inc (BRK-B) | $70.3B | 1.07% | 21 | Financial Services | VOO |
| Walmart Inc. Common Stock (WMT) | $59.3B | 0.90% | 33 | Consumer Defensive | QQQ |
| Exxon Mobil Corp (XOM) | $54.7B | 0.83% | 27 | Energy | XLE |
| Grayscale Bitcoin Mini Trust (BTC) | $51.6B | 0.79% | 1 | N/A | IBIT |
| Johnson & Johnson (JNJ) | $50.3B | 0.77% | 32 | Healthcare | VOO |
| Visa Inc. Class A (V) | $50.2B | 0.76% | 33 | Financial Services | VOO |
| Micron Technology Inc (MU) | $45.7B | 0.70% | 30 | Technology | QQQ |
| Cisco Systems Inc (CSCO) | $43.5B | 0.66% | 34 | Technology | QQQ |
| Costco Wholesale Corp (COST) | $42.3B | 0.64% | 30 | Consumer Defensive | QQQ |
| Taiwan Semiconductor Manufacturing Co. Ltd. (2330) | $42.1B | 0.64% | 8 | Technology | IEMG |
| Advanced Micro Devices Inc (AMD) | $41.0B | 0.62% | 29 | Technology | QQQ |
| Mastercard Inc (MA) | $39.3B | 0.60% | 32 | Financial Services | VOO |
| Palantir Technologies Inc. (PLTR) | $38.6B | 0.59% | 26 | Technology | QQQ |
| Netflix Inc (NFLX) | $38.3B | 0.58% | 27 | Communication Services | QQQ |
All percentages in this section are shares of mapped exposure, which totals about $6.57T in this snapshot. This mapped total is lower than in other exchnange sources because some ETFs do contain holdings whicha are not equity securities, which we do not consider here.
The results show rapid dollar concentration. The top 10 holdings account for about $2.03T of exposure, or 30.9% of mapped exposure. The top 25 holdings account for about $2.78T, or 42.3% of mapped exposure. Even the top of the list is large on its own. The top three holdings, NVDA, AAPL, and MSFT, represent about $1.10T of combined exposure, or 16.7% of mapped exposure.
At the top of the ranking, NVIDIA, ticker NVDA, is the largest exposure at $421.5B, which is 6.41% of mapped exposure, followed by Apple, ticker AAPL, at $370.1B, which is 5.63%, and Microsoft, ticker MSFT, at $307.7B, which is 4.68%. The list also includes a Bitcoin related line item. The BTC line totals $51.6B of exposure, which is 0.79% of mapped exposure, coming through iShares Bitcoin Trust, ticker IBIT.
This dollar weighted view also clarifies an important point. Widely held is not the same as systemically large. Some holdings can appear across many ETFs but remain small in dollar terms, while other holdings can rank highly because a small number of very large ETFs allocate meaningfully to them. For example, Taiwan Semiconductor, reported here as the local line 2330, totals $42.1B of exposure, or 0.64% of mapped exposure, and it is concentrated in a handful of global and emerging market funds.
Finally, ticker level rankings can split economic exposure across share classes. Alphabet appears as both GOOGL and GOOG. Combined, they total $282.7B of exposure, which is 4.30% of mapped exposure, which is material even though it is split across two lines.
Overall, this leaderboard is a map of where mapped Top 100 ETF dollars are most concentrated. The next section breaks these exposures down by fund to show which ETFs contribute the largest share of each crowded position.
To measure how shared the underlying portfolio is across the Top 100 U.S. listed ETFs, we ranked holdings by ETF count, which is the number of ETFs out of 100 that report holding a given stock. This metric captures breadth, not size. A stock can rank highly because it appears in many funds, even if it is a small position in most of them.
| Stock | # ETFs | Sector | Median Weight | Weight Range |
|---|---|---|---|---|
| Apple Inc (AAPL) | 40 | Technology | 6.47% | 0.01%-14.90% |
| Microsoft Corporation (MSFT) | 38 | Technology | 5.18% | 0.01%-12.19% |
| Broadcom Inc (AVGO) | 38 | Technology | 2.75% | 0.01%-7.57% |
| NVIDIA Corporation (NVDA) | 37 | Technology | 7.61% | 0.01%-18.99% |
| Amazon.com Inc (AMZN) | 36 | Consumer Cyclical | 3.35% | 0.01%-5.00% |
| Alphabet Inc Class A (GOOGL) | 34 | Communication Services | 2.95% | 0.01%-11.11% |
| Cisco Systems Inc (CSCO) | 34 | Technology | 0.58% | 0.01%-3.95% |
| Lam Research Corp (LRCX) | 34 | Technology | 0.48% | 0.01%-5.63% |
| Applied Materials Inc (AMAT) | 34 | Technology | 0.42% | 0.01%-4.97% |
| Walmart Inc. Common Stock (WMT) | 33 | Consumer Defensive | 0.94% | 0.01%-3.33% |
| Visa Inc. Class A (V) | 33 | Financial Services | 0.93% | 0.01%-7.22% |
| Amgen Inc (AMGN) | 33 | Healthcare | 0.33% | 0.01%-4.61% |
| Johnson & Johnson (JNJ) | 32 | Healthcare | 0.94% | 0.01%-10.14% |
| Mastercard Inc (MA) | 32 | Financial Services | 0.75% | 0.01%-5.77% |
| PepsiCo Inc (PEP) | 32 | Consumer Defensive | 0.38% | 0.01%-3.98% |
| Meta Platforms Inc. (META) | 31 | Communication Services | 3.23% | 0.82%-20.42% |
| JPMorgan Chase & Co (JPM) | 31 | Financial Services | 1.46% | 0.01%-11.29% |
| Eli Lilly and Company (LLY) | 31 | Healthcare | 1.39% | 0.01%-14.63% |
| AbbVie Inc (ABBV) | 31 | Healthcare | 0.66% | 0.01%-6.96% |
| The Coca-Cola Company (KO) | 31 | Consumer Defensive | 0.46% | 0.01%-3.90% |
| International Business Machines (IBM) | 31 | Technology | 0.46% | 0.01%-3.64% |
| Texas Instruments Incorporated (TXN) | 31 | Technology | 0.34% | 0.01%-4.98% |
| Alphabet Inc Class C (GOOG) | 30 | Communication Services | 2.50% | 0.01%-8.88% |
| Costco Wholesale Corp (COST) | 30 | Consumer Defensive | 0.71% | 0.01%-2.31% |
| Micron Technology Inc (MU) | 30 | Technology | 0.69% | 0.01%-6.01% |
Duplication is concentrated in a familiar set of large cap names. Apple, ticker AAPL, is the most duplicated stock, appearing in 40 of 100 ETFs. It is followed by Microsoft, ticker MSFT, and Broadcom, ticker AVGO, at 38 ETFs each, NVIDIA, ticker NVDA, at 37, and Amazon, ticker AMZN, at 36. Among the top 25 most duplicated stocks, Technology accounts for 10 names. Consumer Defensive and Healthcare contribute 4 names each. Communication Services and Financial Services contribute 3 names each. The minimum duplication level in this top 25 list is still high at 30 ETFs.
Weight dispersion shows why ETF count can be misleading if interpreted as risk. For example, AAPL has a median weight of 6.47% across the ETFs that hold it, but its weights range from 0.01% to 14.90%. NVDA has a median weight of 7.61% with a range of 0.01% to 18.99%. This spread indicates that many ETFs hold these names at token weights for index completeness, while a smaller set holds them as defining positions.
This is where the broad but shallow pattern matters. Several holdings are widely duplicated but represent relatively small slices of AUM weighted exposure in the Top 100 complex. In our results, AMAT appears in 34 ETFs but represents about 0.48% AUM share. AMGN appears in 33 at about 0.37%. PEP appears in 32 at about 0.42%. KO, IBM, and TXN each appear in 31, and each is around 0.39% to 0.41% AUM share. These stocks help explain why breadth alone does not identify systemic crowding.
This section identifies the common basket of stocks that repeatedly shows up across ETF wrappers. The next step is to move from how often a stock appears to how much money is actually exposed, which holdings absorb the most AUM weighted exposure across the Top 100 ETFs, and which funds contribute most to that crowding.
After identifying the most widely held stocks, we decomposed each stock’s total AUM weighted exposure by ETF to see where the exposure is actually coming from. For each of the top duplicated stocks, we calculated every ETF’s share of that stock’s total exposure, based on ETF AUM times holding weight, and then summarized concentration using a simple metric, which is the share of exposure explained by the top three contributing ETFs.
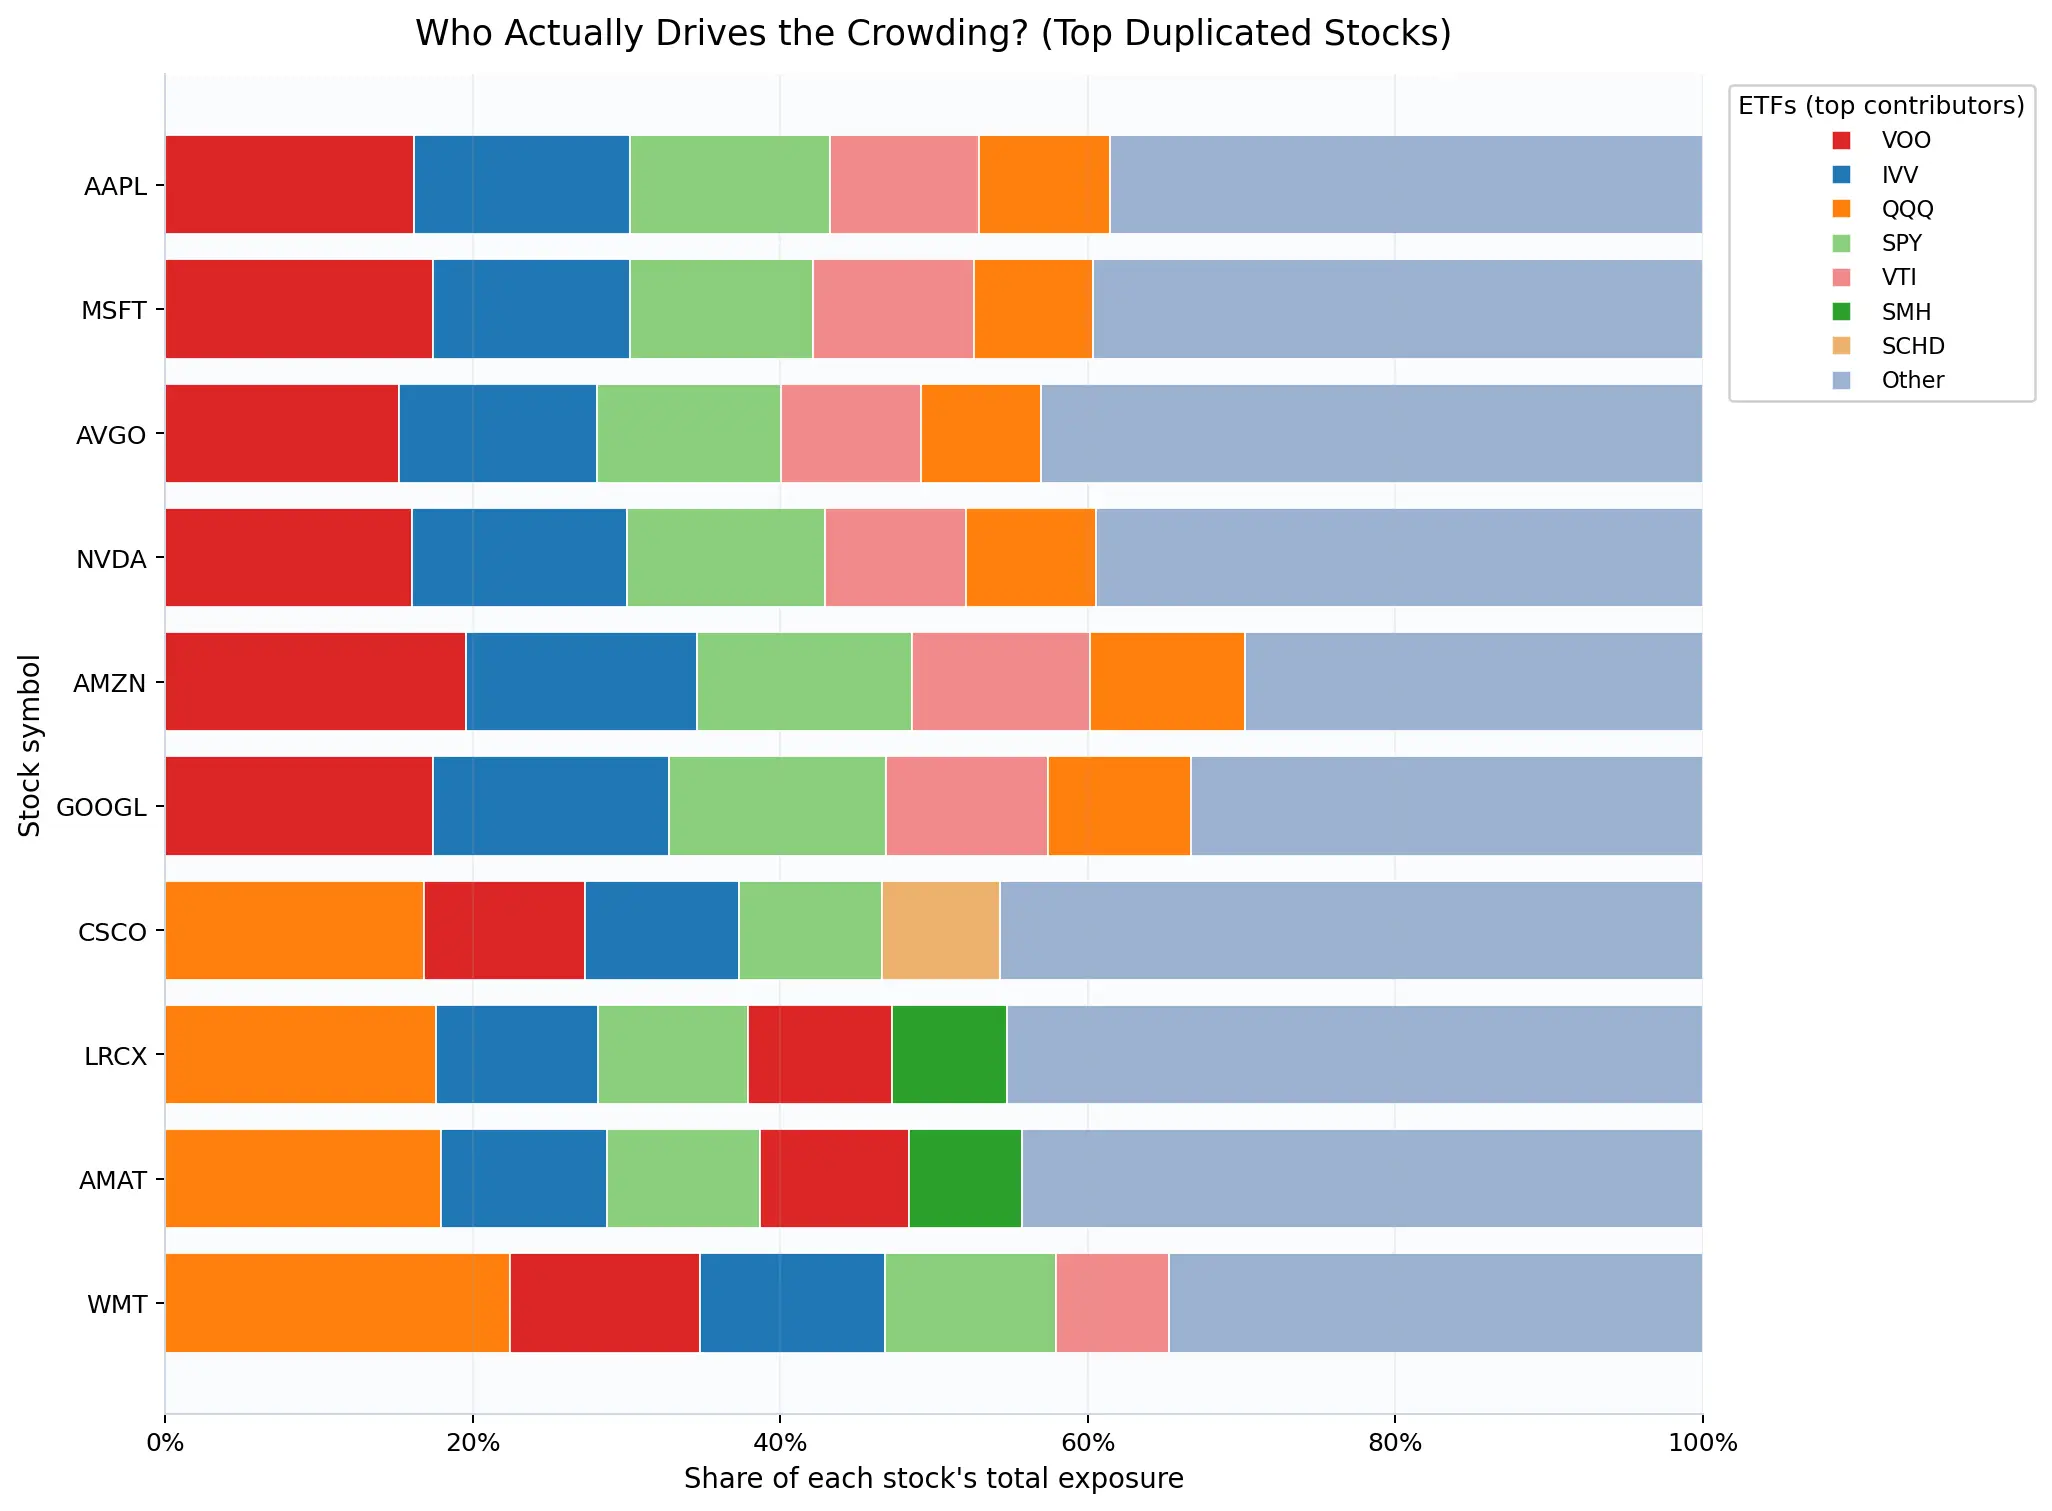
The pattern is consistent. A meaningful portion of exposure to the most duplicated stocks is driven by a small set of mega funds. Across the ten most duplicated stocks in this snapshot, the top three ETFs account for about 37.3% to 48.6% of total exposure per stock. The highest concentration in this set is Amazon, ticker AMZN, where the top three ETFs explain 48.6% of total exposure. Even for the largest, most broadly held mega caps, the top three contribution remains large. Apple, ticker AAPL, is 43.2%, NVIDIA, ticker NVDA, is 42.9%, and Microsoft, ticker MSFT, is 42.1%.
Looking at individual examples clarifies what the metric means. For AAPL, VOO at 16.2%, IVV at 14.0%, and SPY at 13.0% together account for 43.2% of total Top 100 ETF exposure to Apple. For AMZN, the same three funds contribute 19.5%, 15.1%, and 14.0%, respectively, summing to 48.6%. This is not simply a popularity story. It is a capital allocation story, dominated by a handful of very large index ETFs.
At the same time, exposure is not exclusively concentrated in three funds. The remaining exposure sits in a long tail of smaller ETFs, captured in the Other bucket, which is still material across names, for example 29.8% for AMZN and 38.6% for AAPL. The implication is that crowding is best understood as a two layer structure. A small set of mega funds drives a large share of exposure, while many additional funds contribute the rest in aggregate.
This decomposition matters because it separates widely held from systemically crowded. Two stocks can both appear across many ETFs, yet one may be far more sensitive to flows and rebalances in a small number of mega funds. Quantifying who drives the exposure provides a clearer view of where concentration risk originates within the Top 100 ETF complex.
To translate duplication into something investors feel directly, we measured pairwise overlap by weight between popular ETF pairs. For any two ETFs, overlap is defined as the sum of the minimum weight in each shared holding, which is the portion of the portfolio that is effectively owned in both funds. We also report the unique weight for each ETF, which is the portion of weight that does not overlap under the same minimum weight definition. This answers a practical question: when you add a second ETF, how much new exposure are you actually adding versus buying the same underlying positions again?
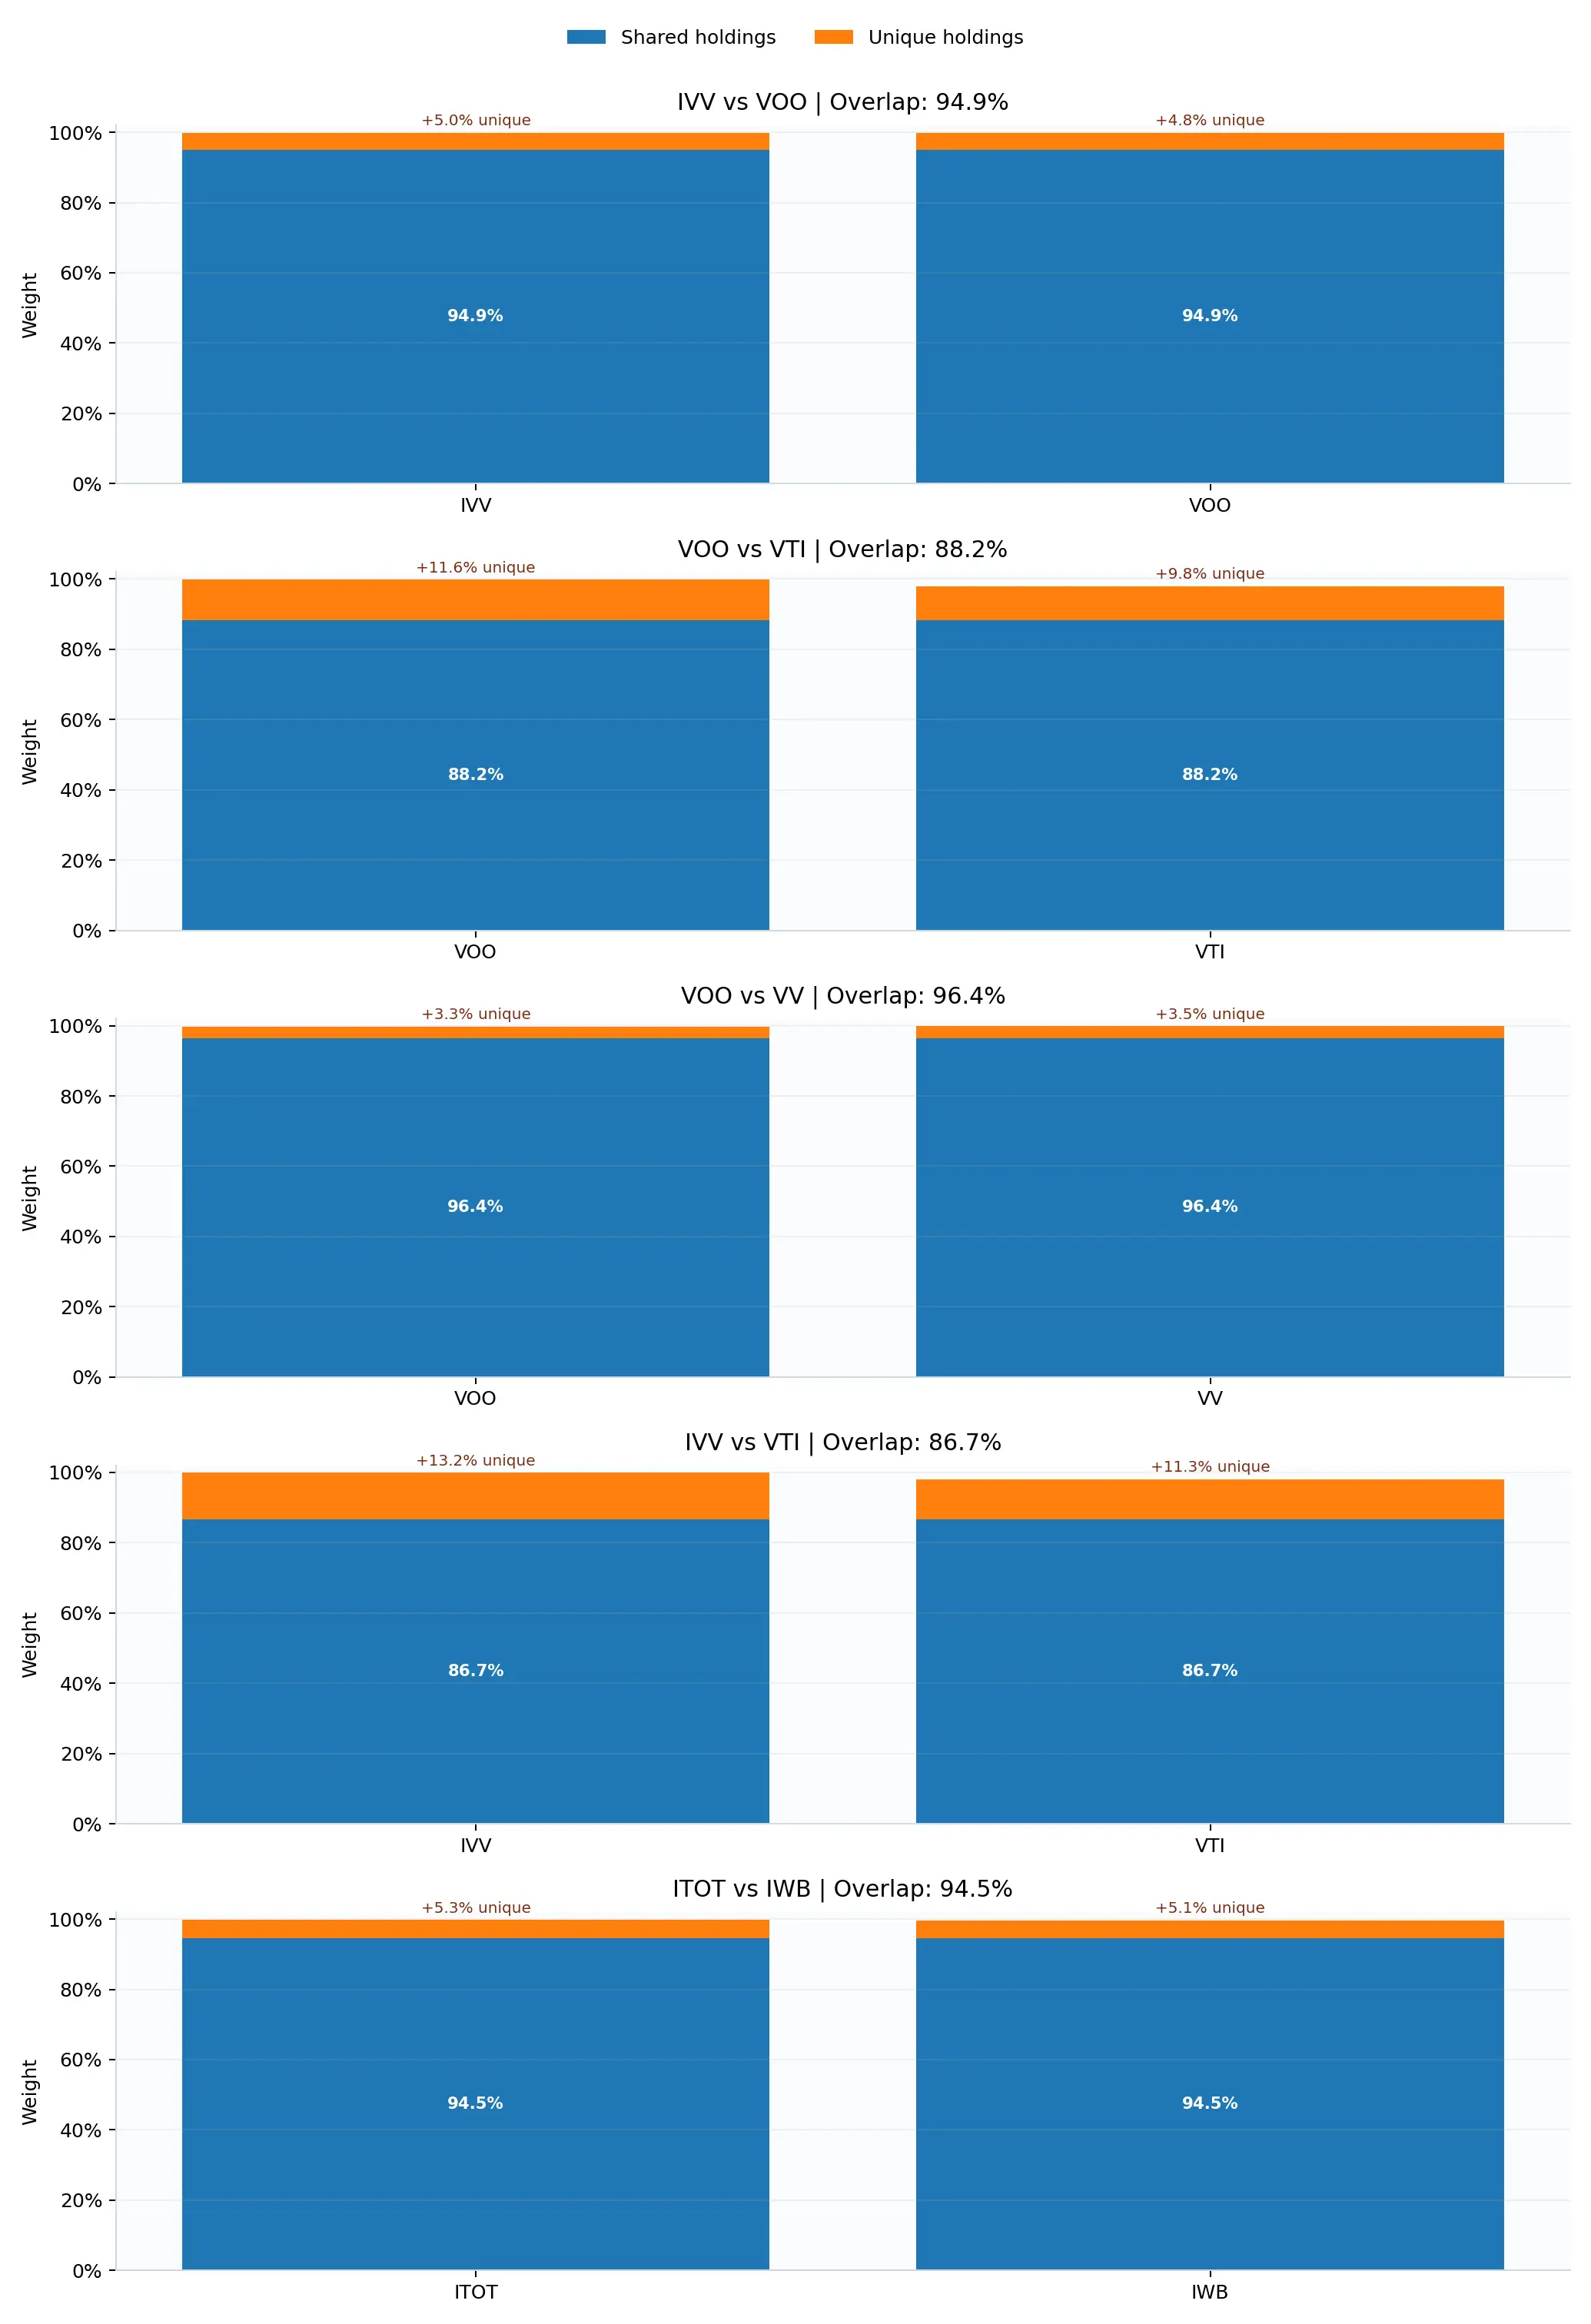
The most extreme example is the core S&P 500 pair IVV (iShares Core S&P 500 ETF), versus VOO (Vanguard S&P 500 ETF). Their portfolios overlap by 94.9% of reported weight, with about 5.0% unique to IVV and about 4.8% unique to VOO in this snapshot. They share 499 underlying holdings, and the overlap is concentrated in the same mega cap names. The largest shared positions include NVIDIA, ticker NVDA, at 7.72%, Apple, ticker AAPL, at 6.81%, Microsoft, ticker MSFT, at 5.17%, Amazon, ticker AMZN, at 3.39%, Alphabet Class A, ticker GOOGL, at 3.11%, Broadcom, ticker AVGO, at 2.71%, Alphabet Class C, ticker GOOG, at 2.49%, Meta Platforms, ticker META, at 2.46%, Tesla, ticker TSLA, at 2.01%, and Berkshire Hathaway at 1.55%. The top 10 shared holdings alone account for about 37.4 percentage points of overlap.
A second common combination is VOO versus VTI (Vanguard Total Stock Market Index Fund ETF Shares). Overlap remains high at 88.2% of reported weight, and the shared core again looks familiar. NVIDIA at 6.56%, Apple at 6.12%, Microsoft at 5.48%, Amazon at 3.38%, and Alphabet Class A at 2.78% are the largest shared positions, followed by Broadcom at 2.49%, Alphabet Class C at 2.20%, Meta Platforms at 2.19%, Tesla at 1.94%, and Eli Lilly, ticker LLY, at 1.39%. Under this overlap definition, VOO has about 11.6% of non overlapping weight relative to VTI, while VTI has about 9.8% of non overlapping weight relative to VOO. This non overlapping weight reflects both holdings that do not match and differences in weights within shared holdings, so it captures weight tilts as well as truly distinct names.
Another broad market comparison is ITOT (iShares Core S&P Total U.S. Stock Market ETF), versus IWB (iShares Russell 1000 ETF). Their overlap is 94.5%, with about 5.3% unique to ITOT and about 5.1% unique to IWB, and they share 980 holdings. The top shared positions are again led by the same mega caps, including NVIDIA at 6.80%, Apple at 6.00%, Microsoft at 4.56%, Amazon at 2.99%, and both Alphabet share classes, with the top 10 shared holdings summing to about 33.0 percentage points of overlap.
Commodity and single asset products are not shown in this overlap set because the holdings data for physically backed metals ETFs in this dataset did not include a usable holding identifier, which prevented a reliable overlap calculation.
Overall, the overlap results reinforce a simple point. Adding more ETF tickers can increase the appearance of diversification without meaningfully increasing unique underlying exposure. A holdings overlap check is therefore a practical step before stacking ETFs, especially within the same broad U.S. equity segments.
This report set out to test a simple idea: buying more ETFs can diversify fund tickers while still concentrating investors in the same underlying holdings. Using the Top 100 U.S. listed ETFs, about $6.57T in total AUM, and holdings reported in SEC Form NPORT, we measured duplication by both breadth, how many ETFs hold a name, and dollars, AUM weighted exposure, and we tested overlap directly on common ETF pairings.
The results show that concentration is structural, not incidental. The top 10 underlying positions account for 30.9% of mapped, dollar weighted exposure, rising to 39.2% for the top 20 and 52.7% for the top 50. The same mega cap stocks repeatedly sit at the center of this exposure, with AAPL held by 40 of 100 ETFs. Exposure is also not evenly distributed across the ETF universe. For the most duplicated names, the top three ETFs contribute about 42.4% of total exposure on average, with values ranging from about 37.3% to 48.6%, which indicates that a small set of mega funds drives a large share of crowding.
For investors and allocators, the implication is straightforward: stacking popular core and growth ETFs often adds more of the same underlying risk. In the overlap results, some widely used ETF pairs are close substitutes in holdings terms. IVV vs VOO shows 94.9% overlap by weight, and VOO vs VTI shows 88.2%. Category results point to the same mechanism. Large Growth funds allocate a large share of portfolio weight to a common basket of stocks, with a median overlap of 66.3% in this snapshot, which increases portfolio co movement even when ETF labels differ.
These findings should be interpreted with the usual filing data constraints. Form NPORT holdings reflect a reporting period and are disclosed with a lag, and security identifiers can vary across filings. Even with those limitations, the central conclusion holds: in the largest U.S. ETFs, diversification by wrapper can mask concentration in underlying exposures.
This report isn’t a call to abandon ETFs. It’s a call to measure what you actually own.
Here are three simple, practical rules that follow directly from the data:
If the top 10 underlying names explain a third of the ETF ecosystem, they often explain a large share of your portfolio’s movement too.
A fast self-check:
Shared holdings count is intuitive but misleading. Overlap by weight answers what you actually need:
If your holdings are dominated by the same U.S. mega-cap basket, adding more U.S. large-cap ETFs usually increases concentration.
Diversification tends to show up when you add genuinely different drivers, like:
This section documents the data construction rules behind the ETF overlap analysis so you can interpret the rankings and exposure metrics correctly.
| Symbol | Company Name |
|---|---|
| VOO | Vanguard S&P 500 ETF |
| IVV | iShares Core S&P 500 ETF |
| SPY | SPDR S&P 500 ETF Trust |
| VTI | Vanguard Total Stock Market ETF |
| QQQ | Invesco QQQ Trust Series I |
| VEA | Vanguard FTSE Developed Markets ETF |
| VUG | Vanguard Growth ETF |
| IEFA | iShares Core MSCI EAFE ETF |
| GLD | SPDR Gold Shares |
| VTV | Vanguard Value ETF |
| BND | Vanguard Total Bond Market ETF |
| IEMG | iShares Core MSCI Emerging Markets ETF |
| AGG | iShares Core U.S. Aggregate Bond ETF |
| VXUS | Vanguard Total International Stock ETF |
| IWF | iShares Russell 1000 Growth ETF |
| VWO | Vanguard FTSE Emerging Markets ETF |
| VGT | Vanguard Information Technology ETF |
| IJH | iShares Core S&P Mid-Cap ETF |
| SPYM | SPDR Portfolio S&P 500 ETF |
| VIG | Vanguard Dividend Appreciation ETF |
| IJR | iShares Core S&P Small-Cap ETF |
| VO | Vanguard Mid-Cap ETF |
| XLK | Technology Select Sector SPDR Fund |
| RSP | Invesco S&P 500 Equal Weight ETF |
| SCHD | Schwab US Dividend Equity ETF |
| ITOT | iShares Core S&P Total U.S. Stock Market ETF |
| IAU | iShares Gold Trust |
| IWM | iShares Russell 2000 ETF |
| EFA | iShares MSCI EAFE ETF |
| BNDX | Vanguard Total International Bond ETF |
| VYM | Vanguard High Dividend Yield ETF |
| VB | Vanguard Small-Cap ETF |
| SGOV | iShares 0-3 Month Treasury Bond ETF |
| QQQM | Invesco NASDAQ 100 ETF |
| IWD | iShares Russell 1000 Value ETF |
| IVW | iShares S&P 500 Growth ETF |
| SCHX | Schwab U.S. Large-Cap ETF |
| VT | Vanguard Total World Stock ETF |
| VCIT | Vanguard Intermediate-Term Corporate Bond ETF |
| VEU | Vanguard FTSE All-World ex-US ETF |
| SCHF | Schwab International Equity ETF |
| IXUS | iShares Core MSCI Total International Stock ETF |
| XLF | Financial Select Sector SPDR Fund |
| IBIT | iShares Bitcoin Trust ETF |
| SCHG | Schwab U.S. Large-Cap Growth ETF |
| IVE | iShares S&P 500 Value ETF |
| QUAL | iShares MSCI USA Quality Factor ETF |
| IWR | iShares Russell Mid-Cap ETF |
| VV | Vanguard Large-Cap ETF |
| IEF | iShares 7-10 Year Treasury Bond ETF |
| IWB | iShares Russell 1000 ETF |
| DIA | SPDR Dow Jones Industrial Average ETF Trust |
| TLT | iShares 20+ Year Treasury Bond ETF |
| SMH | VanEck Semiconductor ETF |
| SPYG | SPDR Portfolio S&P 500 Growth ETF |
| JEPI | JPMorgan Equity Premium Income ETF |
| BSV | Vanguard Short-Term Bond ETF |
| SLV | iShares Silver Trust |
| VTEB | Vanguard Tax-Exempt Bond ETF |
| BIL | SPDR Bloomberg 1-3 Month T-Bill ETF |
| MUB | iShares National Muni Bond ETF |
| DFAC | Dimensional U.S. Core Equity 2 ETF |
| XLV | Health Care Select Sector SPDR Fund |
| VCSH | Vanguard Short-Term Corporate Bond ETF |
| VGIT | Vanguard Intermediate-Term Treasury ETF |
| MBB | iShares MBS ETF |
| SCHB | Schwab U.S. Broad Market ETF |
| DGRO | iShares Core Dividend Growth ETF |
| SPDW | SPDR Portfolio Developed World ex-US ETF |
| VONG | Vanguard Russell 1000 Growth ETF |
| JPST | JPMorgan Ultra-Short Income ETF |
| VNQ | Vanguard Real Estate ETF |
| GOVT | iShares U.S. Treasury Bond ETF |
| XLE | Energy Select Sector SPDR Fund |
| IUSB | iShares Core Total USD Bond Market ETF |
| VBR | Vanguard Small-Cap Value ETF |
| JEPQ | JPMorgan Nasdaq Equity Premium Income ETF |
| SPYV | SPDR Portfolio S&P 500 Value ETF |
| DYNF | iShares U.S. Equity Factor Rotation Active ETF |
| GDX | VanEck Gold Miners ETF |
| GLDM | SPDR Gold MiniShares Trust |
| VGK | Vanguard FTSE Europe ETF |
| EFV | iShares MSCI EAFE Value ETF |
| MGK | Vanguard Mega Cap Growth ETF |
| CGDV | Capital Group Dividend Value ETF |
| XLI | Industrial Select Sector SPDR Fund |
| LQD | iShares iBoxx $ Investment Grade Corporate Bond ETF |
| OEF | iShares S&P 100 ETF |
| IDEV | iShares Core MSCI International Developed Markets ETF |
| BIV | Vanguard Intermediate-Term Bond ETF |
| TQQQ | ProShares UltraPro QQQ |
| EEM | iShares MSCI Emerging Markets ETF |
| VGSH | Vanguard Short-Term Treasury ETF |
| ACWI | iShares MSCI ACWI ETF |
| IUSG | iShares Core S&P U.S. Growth ETF |
| JAAA | Janus Henderson AAA CLO ETF |
| XLC | Communication Services Select Sector SPDR Fund |
| VXF | Vanguard Extended Market ETF |
| USHY | iShares Broad USD High Yield Corporate Bond ETF |
| MDY | SPDR S&P MidCap 400 ETF Trust |
Holdings and fund net assets were sourced from SEC EDGAR Form N-PORT filings, available via the Form N-PORT data sets.
Form N-PORT is to be used by a registered management investment company, or an exchange-traded fund organized as a unit investment trust, or series thereof (Fund). For each ETF, we used the latest available N-PORT filing as of the data pull date (Q4 2025).
For ETF pairs, overlap by weight is computed as the sum of the minimum weight for each shared holding in ETF A and ETF B.
Unique A and Unique B are the remaining weights not shared with the other ETF.